SideShift.ai Weekly Report | 4th - 10th July 2023
SideShift Weekly Report: Most popular coins, XAI staking performance, and other interesting insights about SideShift.ai and the cryptocurrency space. Welcome to the sixty-second edition of the weekly stats report - your one-stop shop for all things SideShift.ai.
Welcome to the sixty-second edition of the weekly stats report - your one-stop shop for all things SideShift.ai.
XAI Token Market Update
This week SideShift token (XAI) moved within the 7 day range of $0.1086 / $0.1177 . At the time of writing, the price of XAI is sitting at the lower end of that bound at a price of $0.1094. The current market cap of XAI is $14,022,611 (-0.9%) as denoted on our Dune Dashboard.
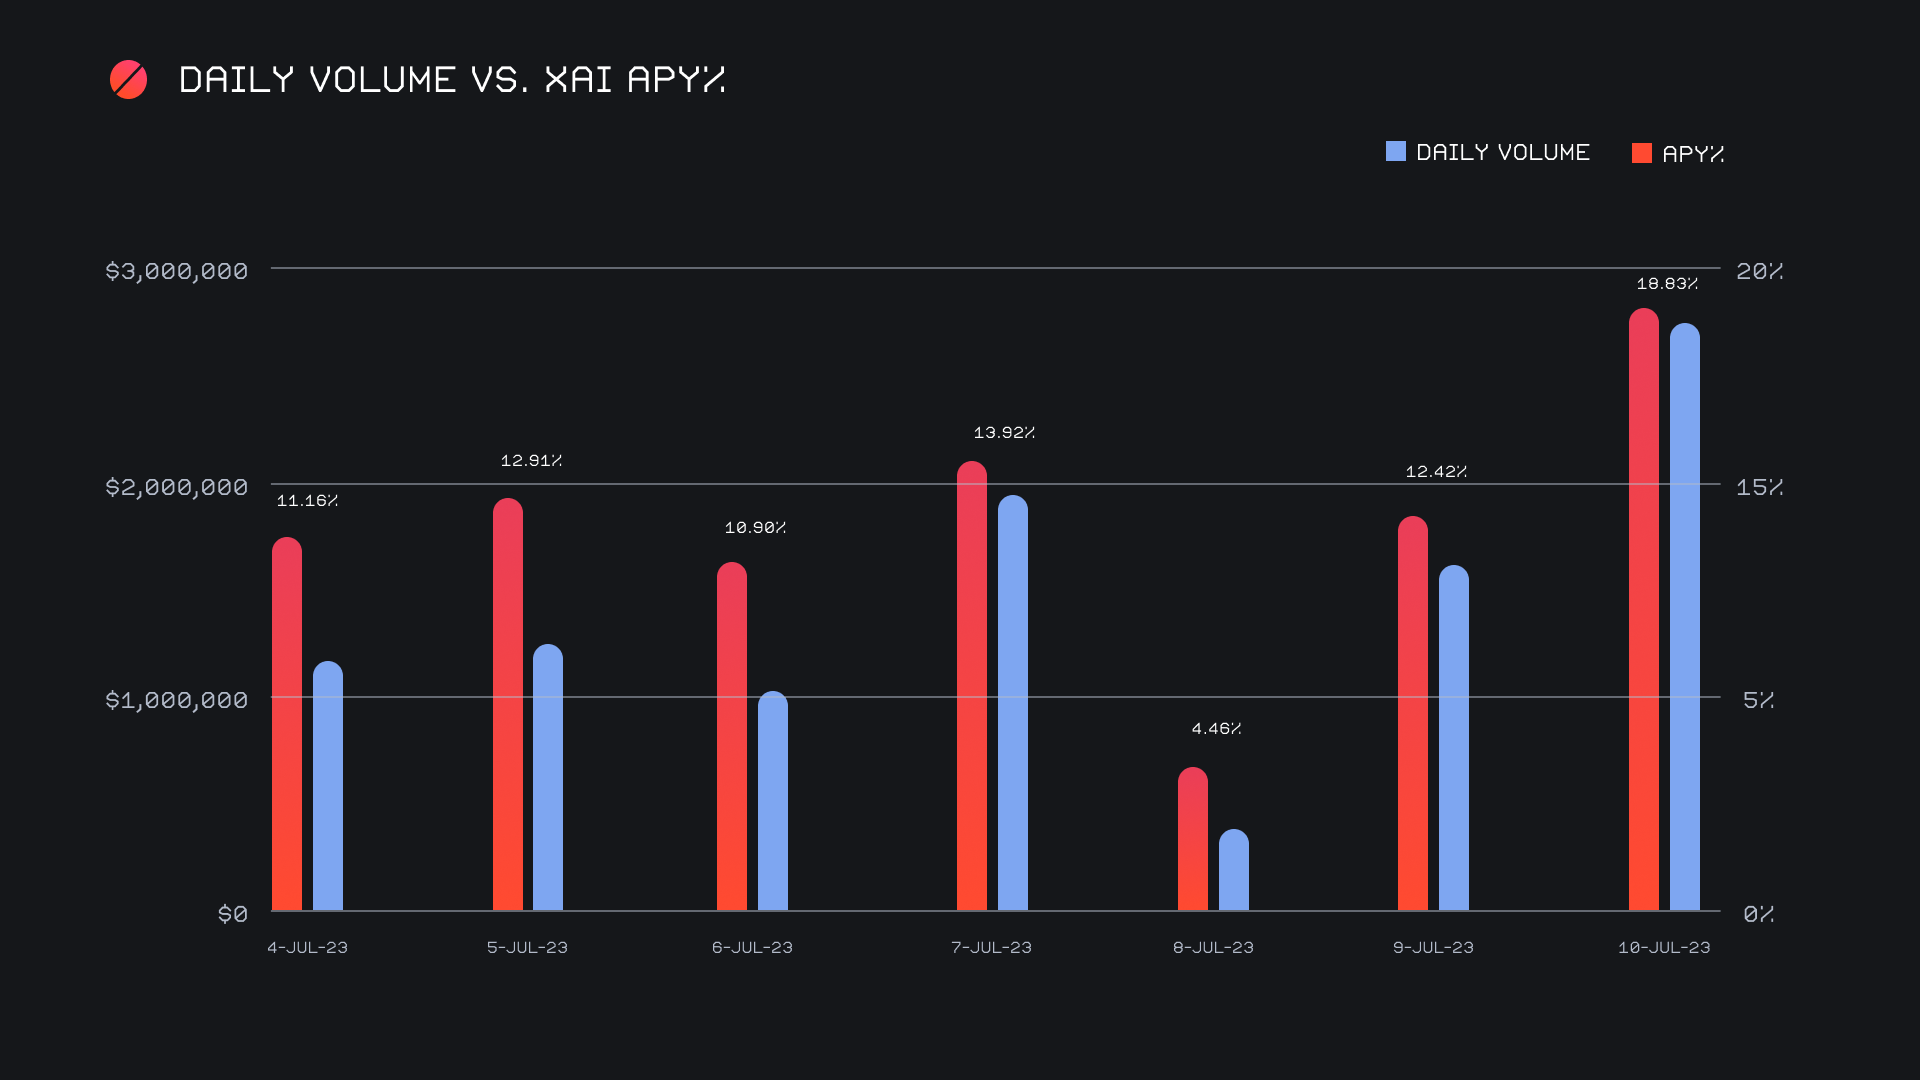
XAI stakers were rewarded with an average APY of 12.24% this week, with a daily rewards high of 51,115.43 XAI (an APY of 18.83%) being distributed to our staking vault on July 11th, 2023. This was following a daily volume of $2.8m. This week XAI stakers received a total of 236,416.64 XAI or $25,783.81 USD in staking rewards.
The price of 1 svXAI is now equal to 1.2121 XAI, representing a 21.21% accrual on user investments. A friendly reminder that the easiest way to participate in SideShift staking is to shift directly to svXAI, from any coin of your choice.
An additional 50 ETH was added to our treasury this week, and the current total is sitting at a value of $5.03m. Users are encouraged to follow along with live treasury updates directly on DeBank.
Additional XAI updates:
Total Value Staked: 106,106,419 XAI (+1.2%)
Total Value Locked: $12,197,895 (+1.5%)
General Business News:
This week saw another wave of Binance FUD hit the news, sparking chatter and speculation about what the future holds. Meanwhile, BTC attempted to break through the 30k resistance zone, only to be rejected and stay firmly put for the time being.
SideShift had a very solid week, rounding off the period with a gross $10.1m (+24%) alongside a shift count of 5,541 (-28.6%). The asymmetrical change here between volume and count tells us the average size of each shift was much higher - our average shift value was $1,830, 73.5% higher than last week’s average of $1,055. When combining volume and count, these weekly figures produced daily averages of $1.5m on 792 shifts. When denoted in BTC, our weekly volume amounted to 334.0476 BTC.
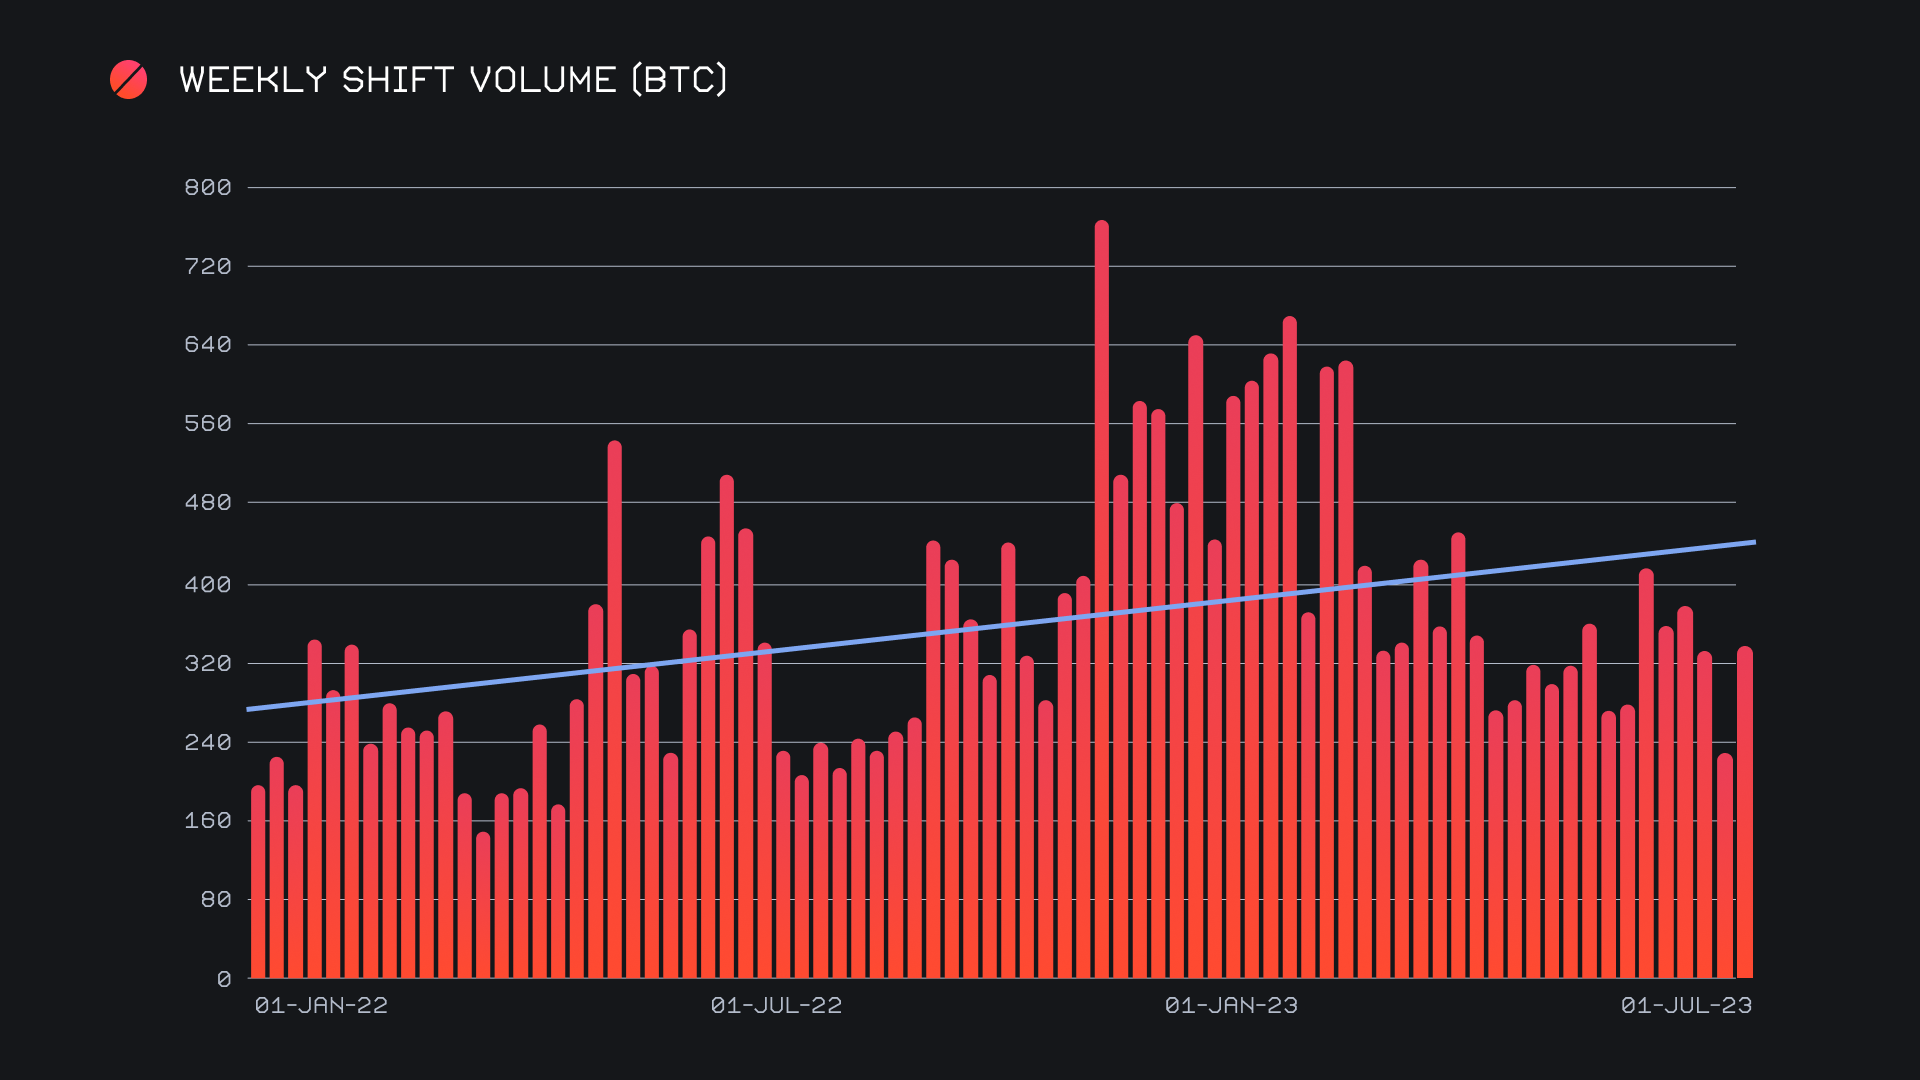
The BTC dominance on SideShift mentioned in last week’s report carried into this week, although with a different composition between deposits and settlements. Whereas last week saw strong BTC buying, this week saw heavy BTC selling. Total BTC volume (deposits + settlements) grew by 38% for a sum of $5.7m, a very respectable growth percentage for our top coin. A deeper look reveals that user BTC deposits rocketed 88.4% for a total $2.8m, the highest user sum since early February 2023. A staggering $2.2m was shifted to USDT (ERC-20), not only making BTC / USDT (ERC-20) the week’s most popular shift pair, but also the highest shift volume for a single pair since early 2023. The $30k price level for BTC is an interesting one, as it seems that the move between buying and selling swings back and forth each week. It might not be until this level is clearly broken one way or another that we see some congruence in shifting patterns.
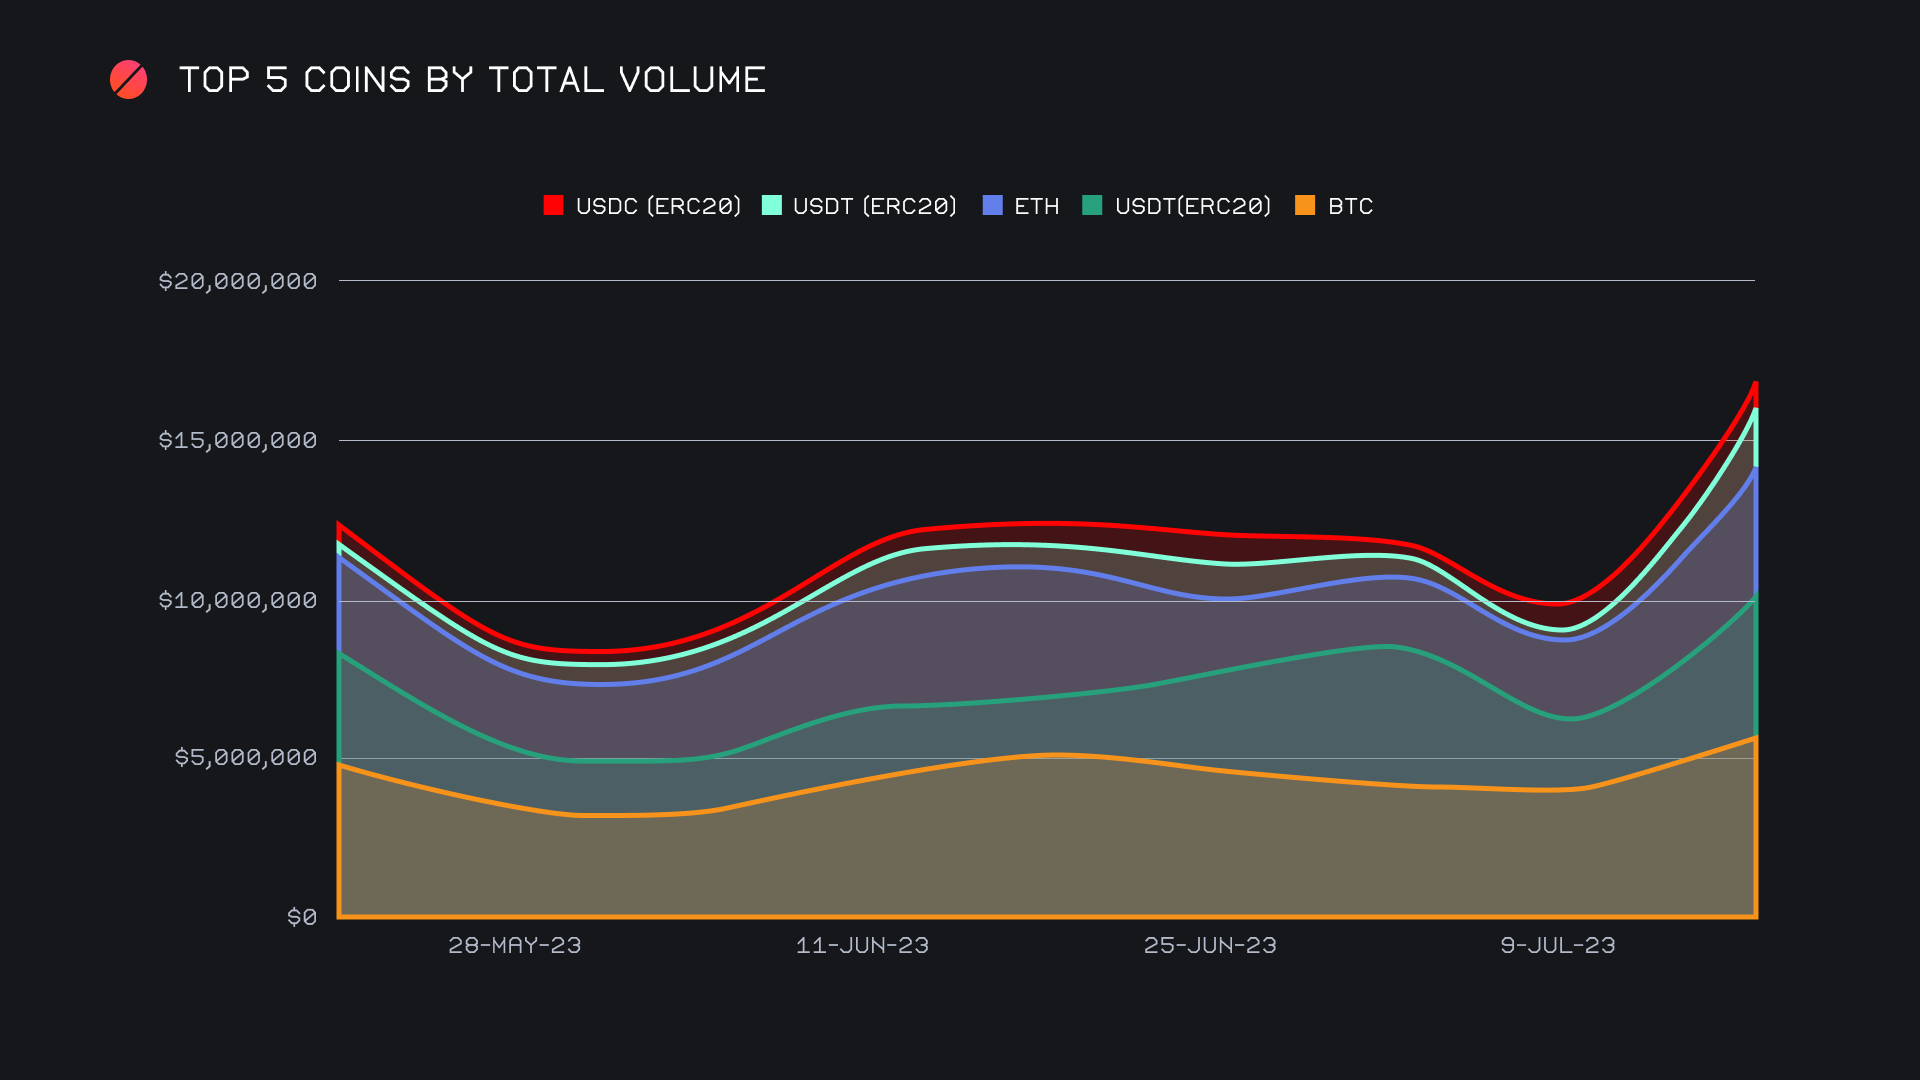
As seen in the chart above, the total volume of all of our top 5 coins increased from last week, producing an upwards sloping trajectory. Every top 5 coin saw a weekly growth rate that exceeded +20%, in addition to their total volume being greater than $1m. This speaks to the intense volume concentration of our top 5 coins.
Within our top 5, it was mainly USDT (ERC-20) and USDT (TRC-20) which rose considerably. Respectively, the total volume of these two stablecoins saw impressive growth percentages of 104.9% ($4.5m), and 367.2% ($1.6m), almost entirely from the settlement sides. Alongside BTC, ETH was the only other non-stablecoin to crack the top 5. It had a solid week as well, netting $4m in total volume, up 58.6% from last week, with the ETH / USDT (TRC-20) pair accounting for $654k of this volume. Furthermore, it’s worth noting that user ETH deposits exceed settlements by more than $1m, once again signifying the directionality of shifting.
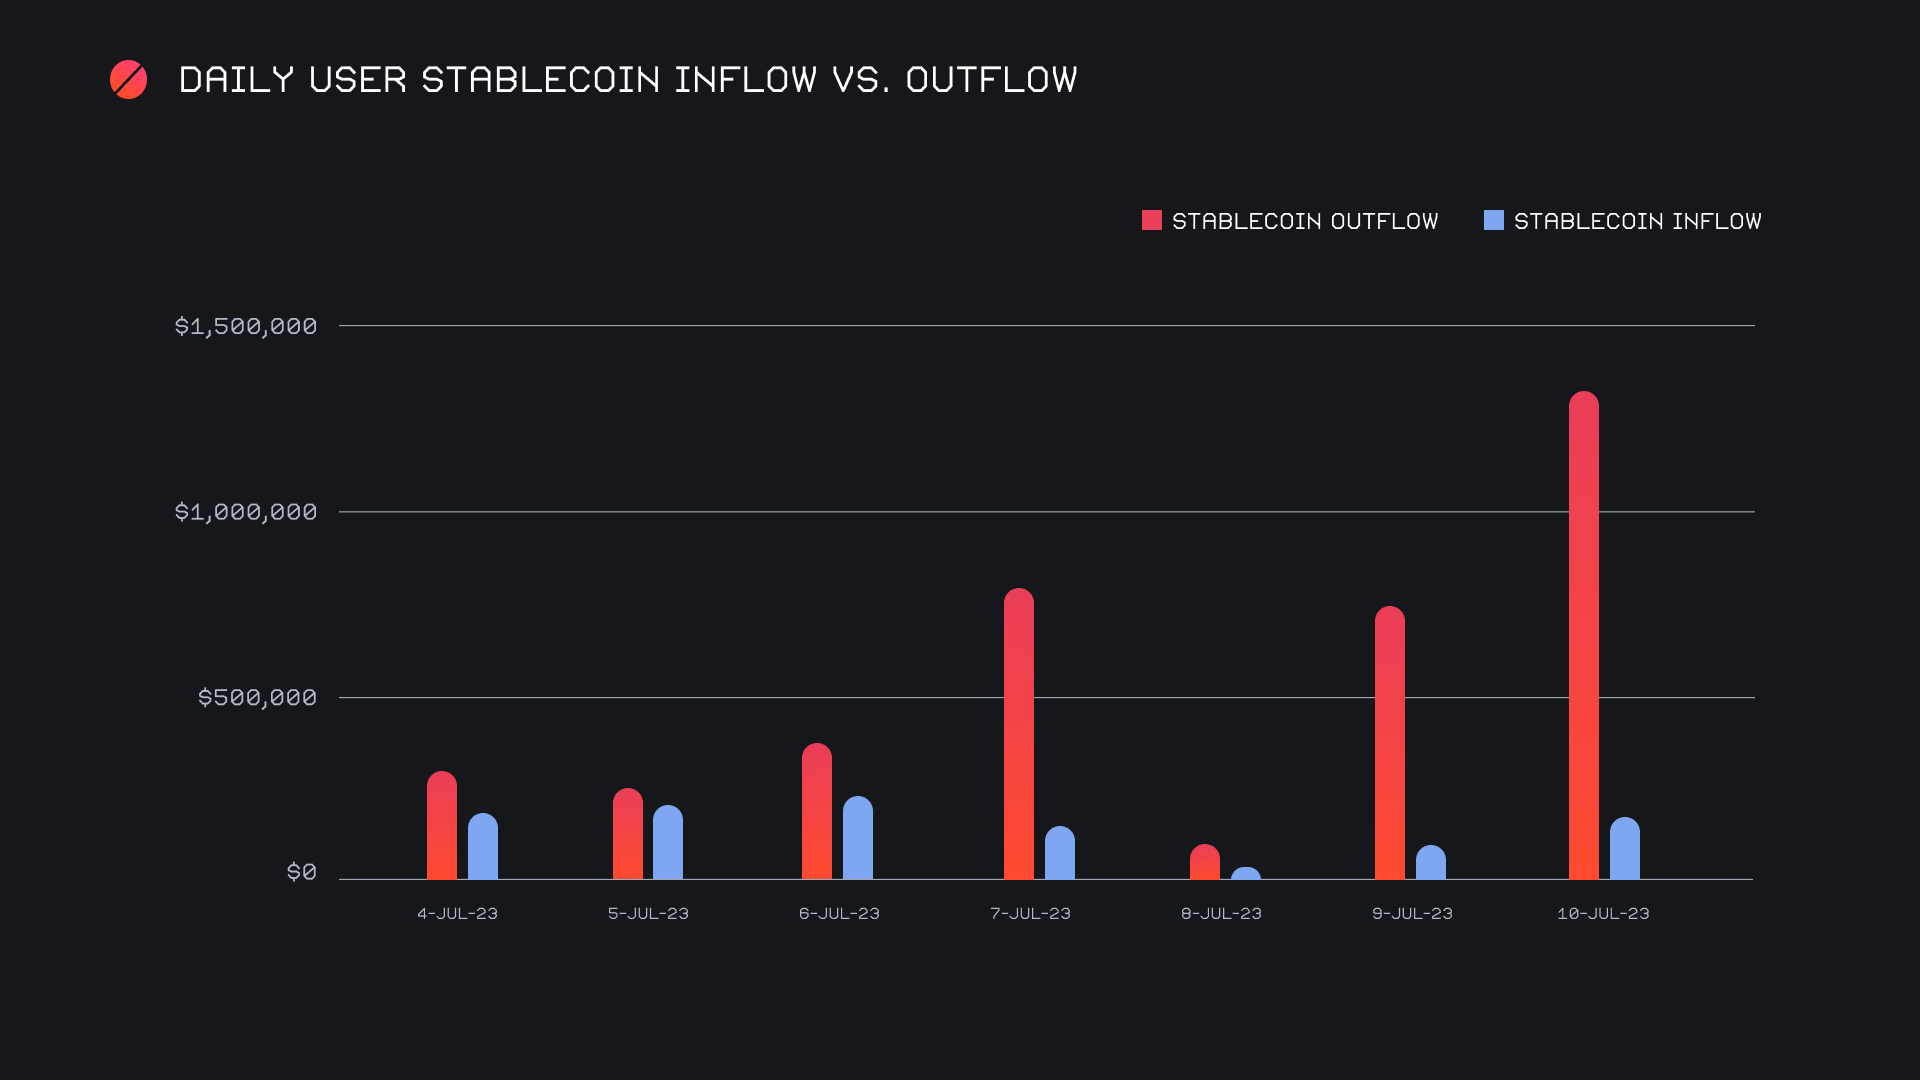
An analysis of this week’s stablecoin shifting shows the biggest discrepancy between inflow and outflow since we began tracking this metric. This week, our net outflow totalled -$2.8m, of which $1.3m occurred on July 10th alone. Additionally, this was correlated with a spike in BTC deposits. Here once again we can see a completely opposite trend from that which was establishing itself at the end of last week. The magnitude of stablecoin outflow dominance is clearly displayed in the chart below.
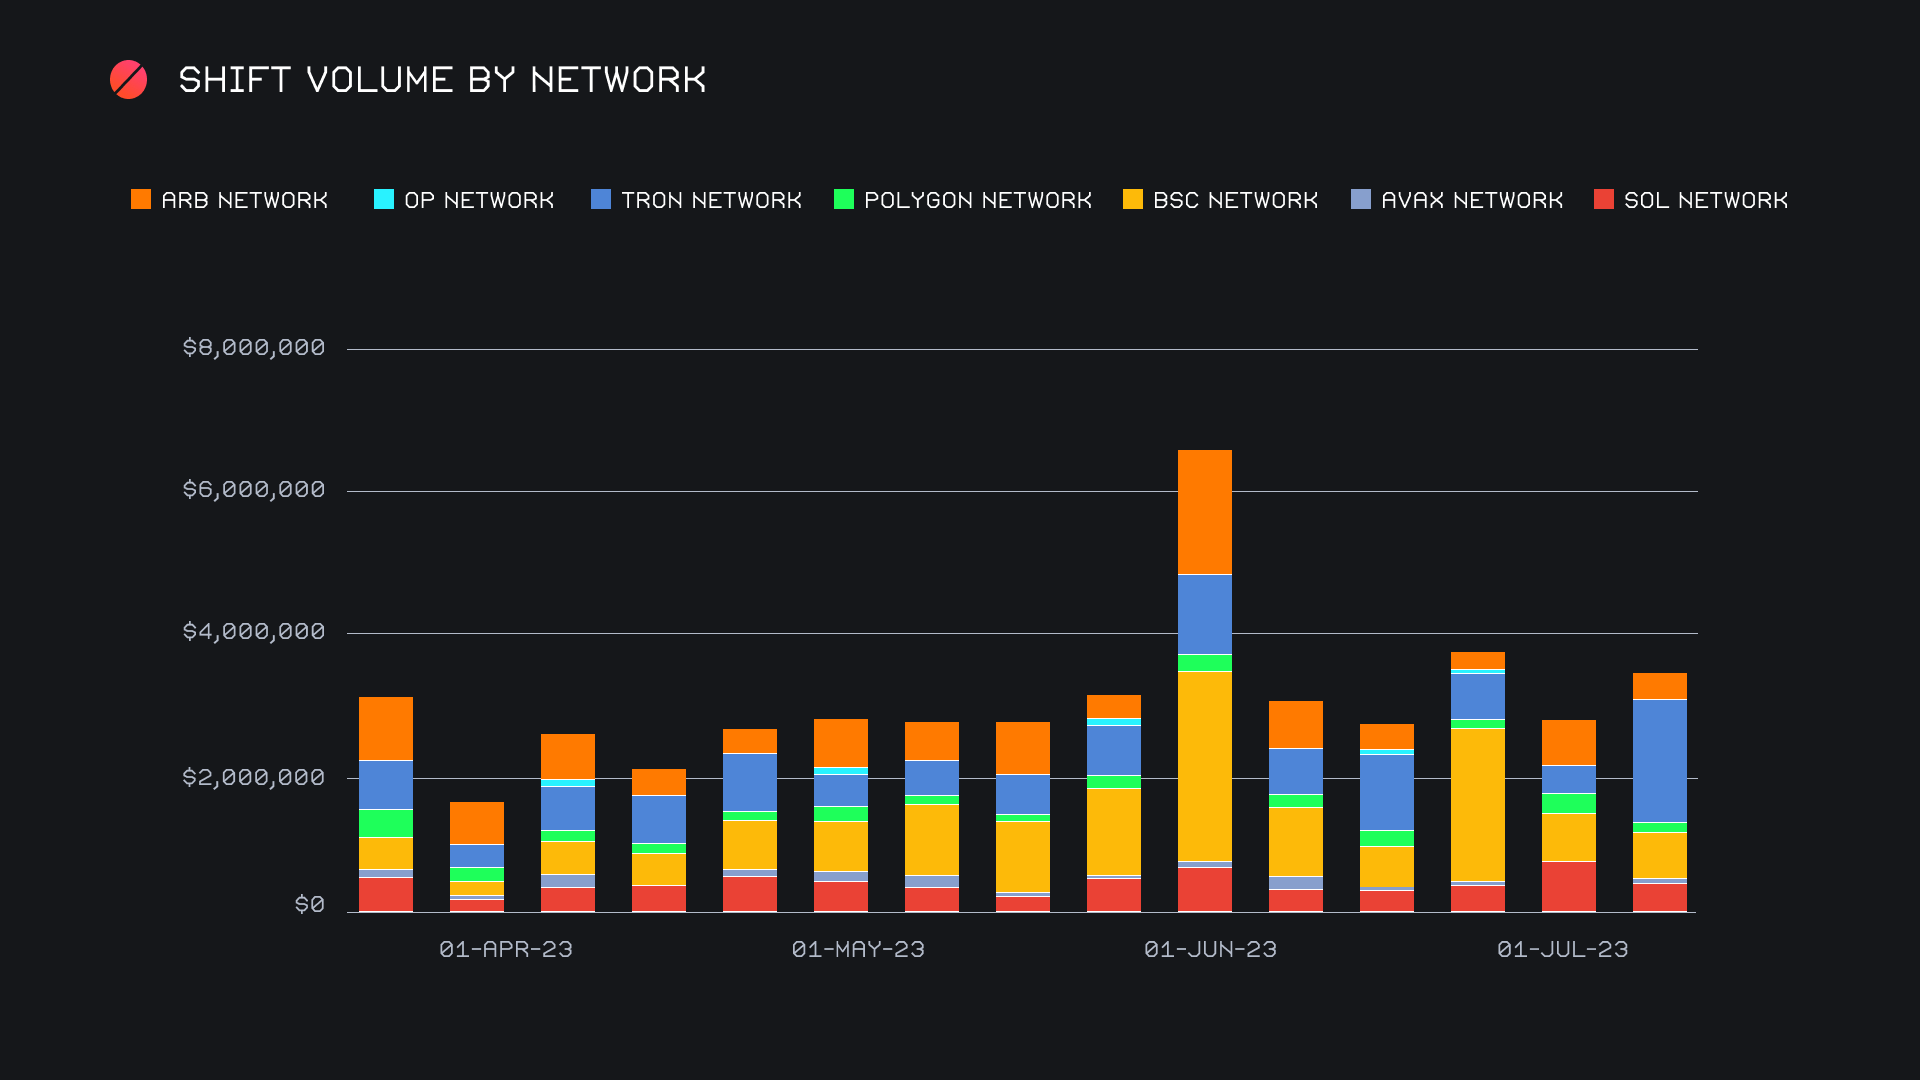
Alternate networks to ETH combined for a gross $3.5m, approximately 27% higher than last week, but largely in line with the average established over the past few months. With that being said this week saw a much different breakdown of that total, as is often the case. The TRON network rebounded with a bang and soared 347.6% to claim the top spot with $1.7m. As previously mentioned, this was driven by USDT (TRC-20) shifting. Interestingly the only other network to see weekly growth was the AVAX network (albeit with a far lower volume of just $88k), while all other networks saw weekly volume declines. The Binance Smart Chain Network (BSC) finished in second place with $632k (-4.9%), while last week’s top network, SOL, finished third with $510 (-36.7%).
In listing news, SideShift added support for 3 assets on 2 networks this past week. The shifting of Maker (MKR), Curve Dao Token (CRV) and Injective (INJ) on the Ethereum network is now live, in addition to CRV on the Arbitrum network.
Affiliate News
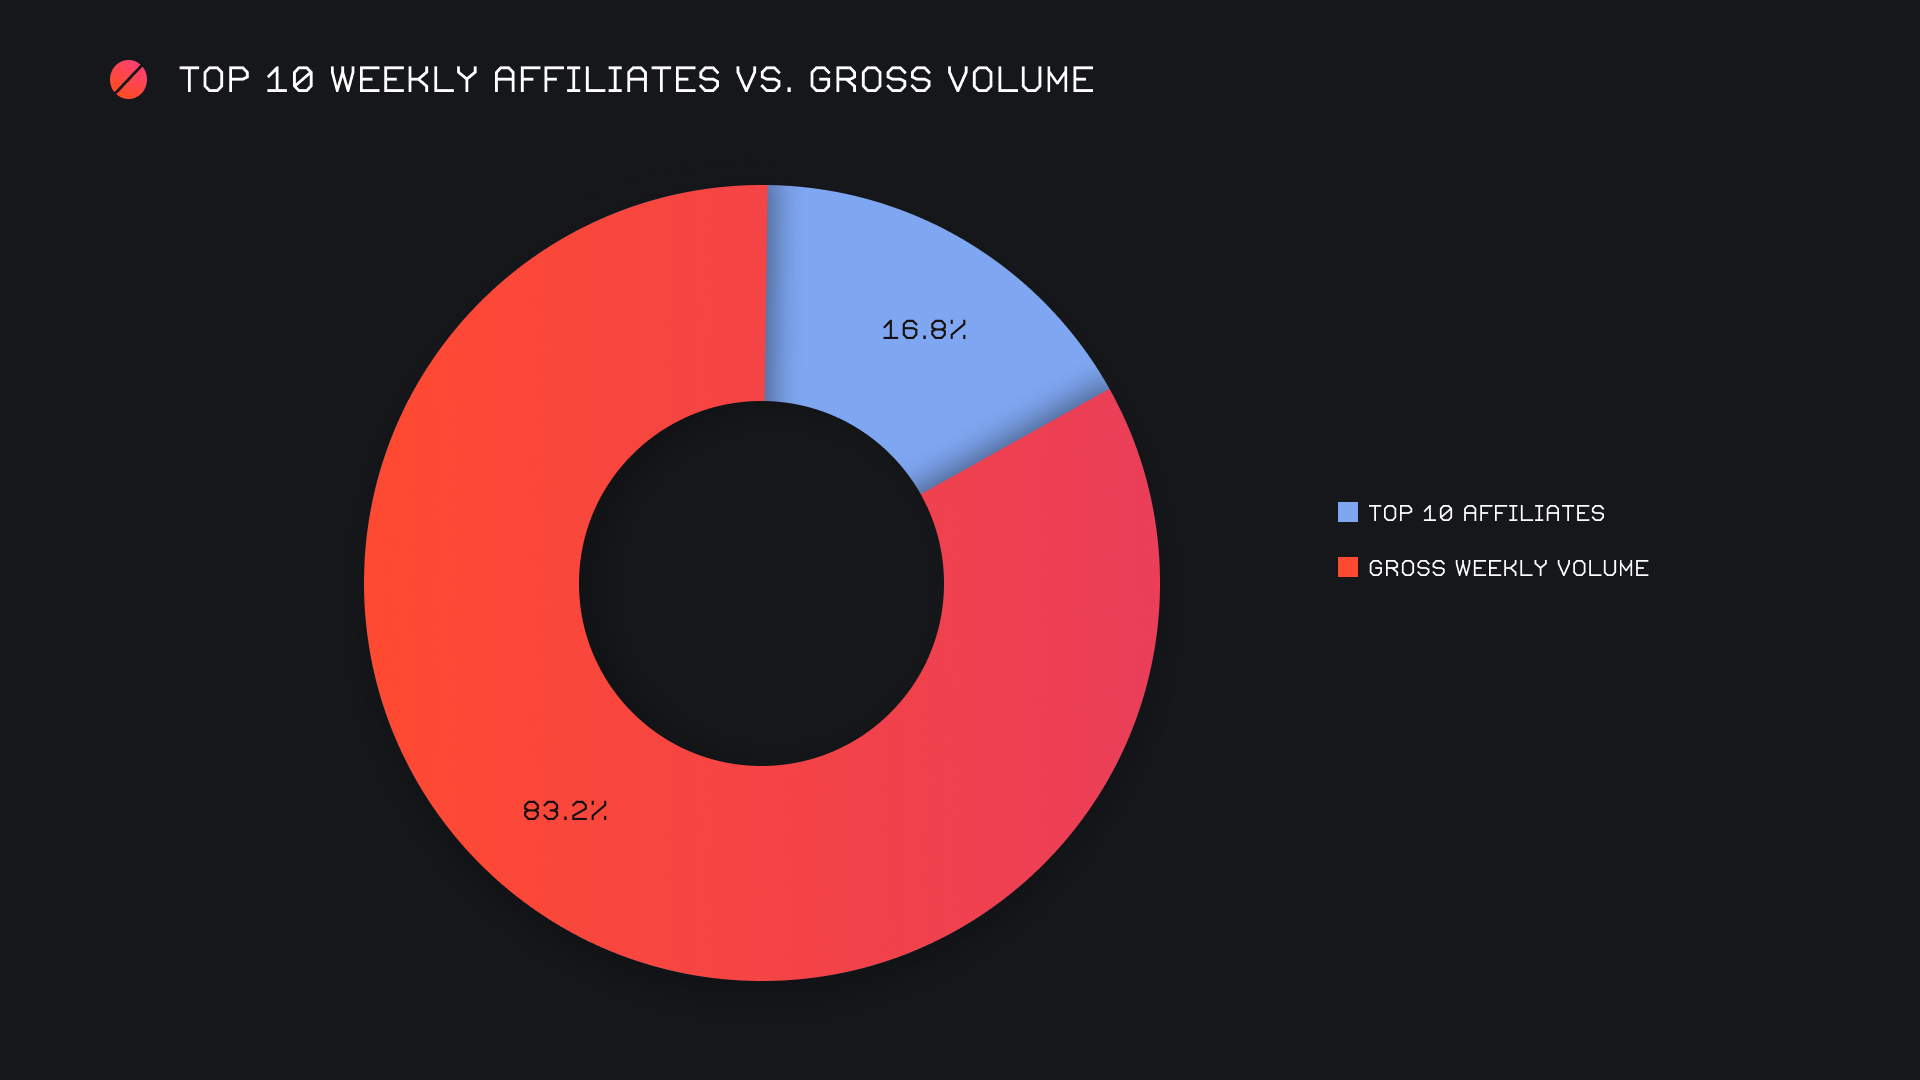
Our top 10 affiliates ended the period with a combined sum of $1.7m (-7.7%). This was alongside a shift count which dropped more significantly, as it fell 16.2% for a total 2,146 shifts. Our top affiliate continues its ongoing strength, as this week it represented 12.8% of our weekly volume and 20.7% of our weekly count. This is now the second week in a row that its count has exceeded 20%.
Overall, the top 10 accounted for 16.8% of our weekly volume, 5.8% lower than last week's proportion.
That’s all for now. Thanks for reading, happy shifting and we’ll see you next time.

