SideShift.ai Weekly Report | 16th - 22nd April 2024
SideShift Weekly Report: Most popular coins, XAI staking performance, and other interesting insights about SideShift.ai and the cryptocurrency space. Welcome to the one-hundred and first edition of the weekly stats report - your one-stop shop for all things SideShift.ai.
Welcome to the one hundred and first edition of the weekly stats report - your one-stop shop for all things SideShift.ai.
This week SideShift token (XAI) moved within the tight 7 day price range of $0.1752 / $0.1785, a minimal change of pattern from what was seen last week. At the time of writing, the price of XAI is sitting at $0.1783 and has a current market cap of $23,834,448 (+1%).
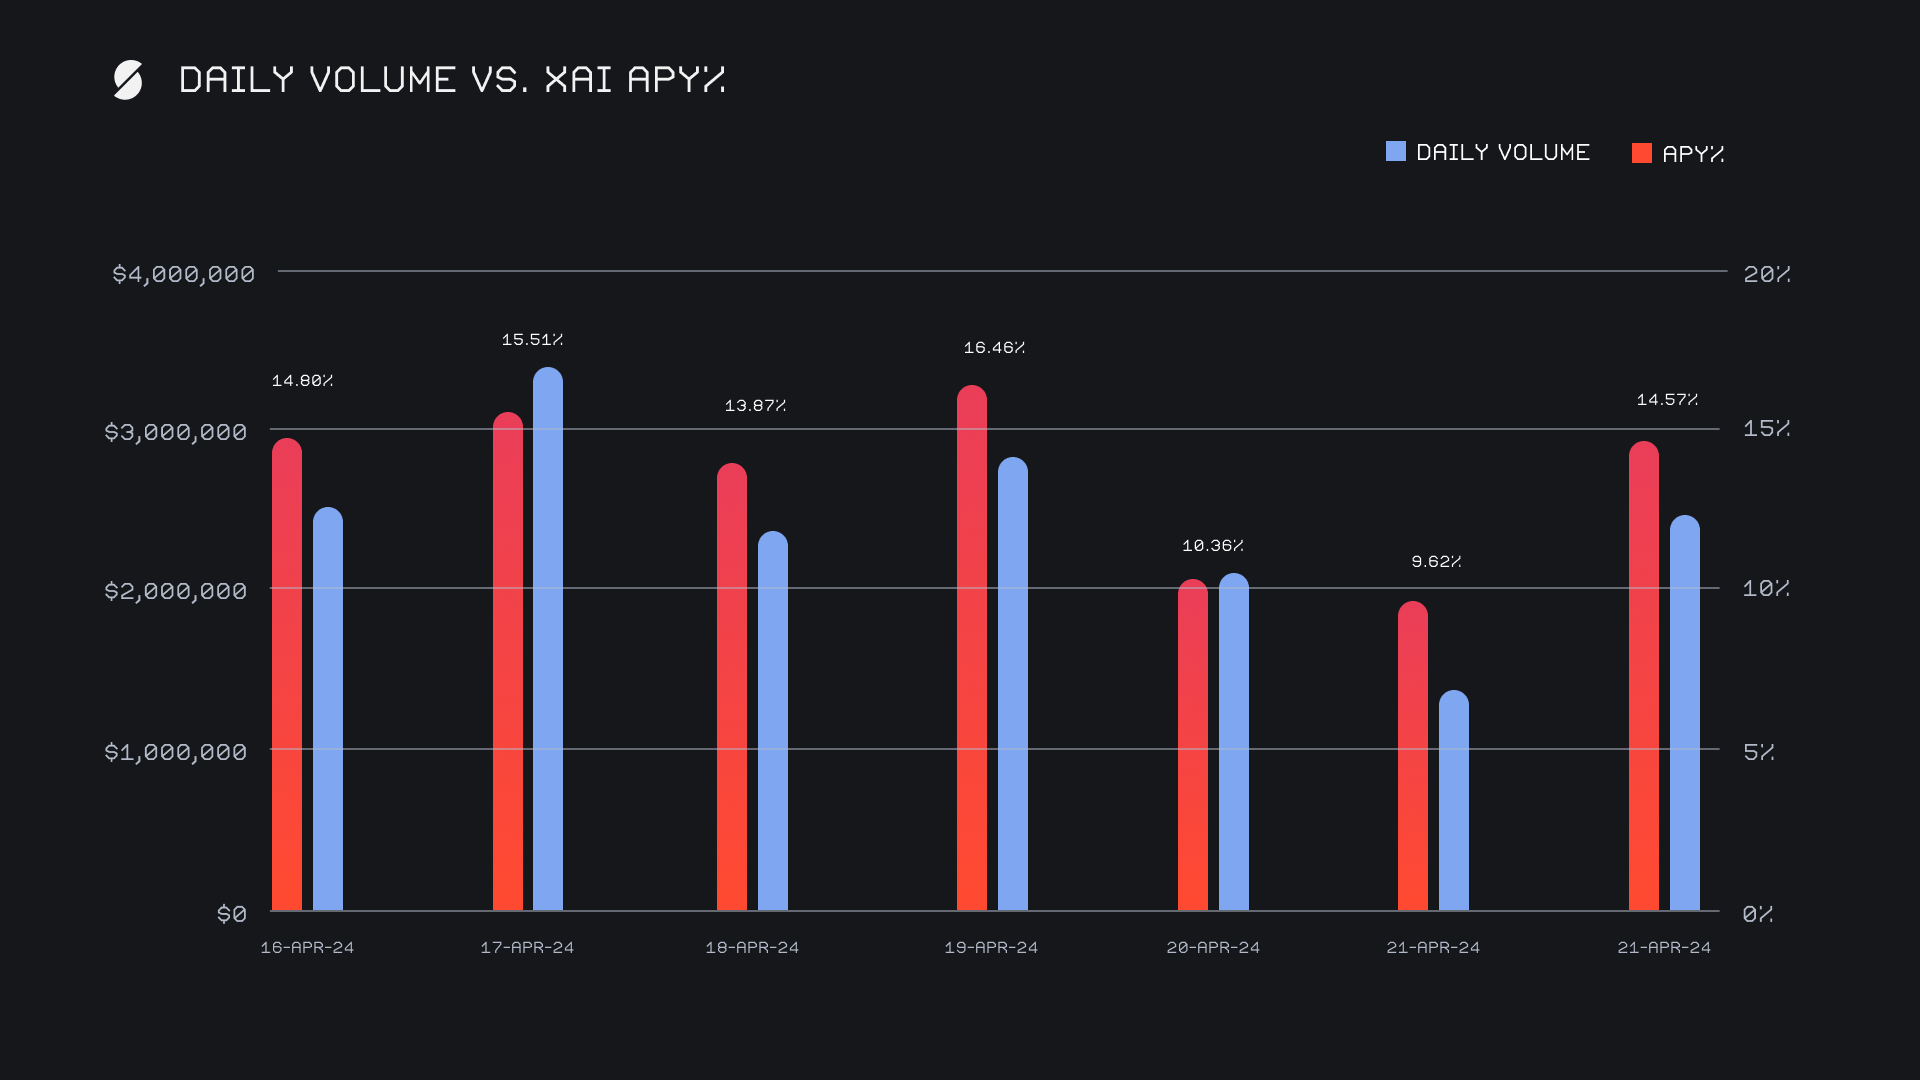
XAI stakers were rewarded with an average APY of 13.60% this week, with a daily rewards high of 49,646.27 XAI (an APY of 16.46%) being distributed to our staking vault on April 20th, 2024. This was following a daily volume of $2.8m. This week XAI stakers received a total of 290,262.48 XAI or $51,753.80 USD in staking rewards.
An additional 2 WBTC was added to SideShift’s treasury, bringing the current total to a value of $13.31m. Users are encouraged to follow along directly with live treasury updates, via sideshift.ai/treasury.
Additional XAI updates:
Total Value Staked: 119,139,968 XAI (+0.2%)
Total Value Locked: $21,179,292 (+0.6%)
General Business News
This past week saw the broader market bounce from local lows, with roughly +10% being added to the total crypto market cap’s ~$2.4 trillion sum. The long awaited BTC halving had a relatively minor impact on its price, at least initially, as it appears to be consolidating within the approximate $60k - $70k price range formed over the past couple of months.
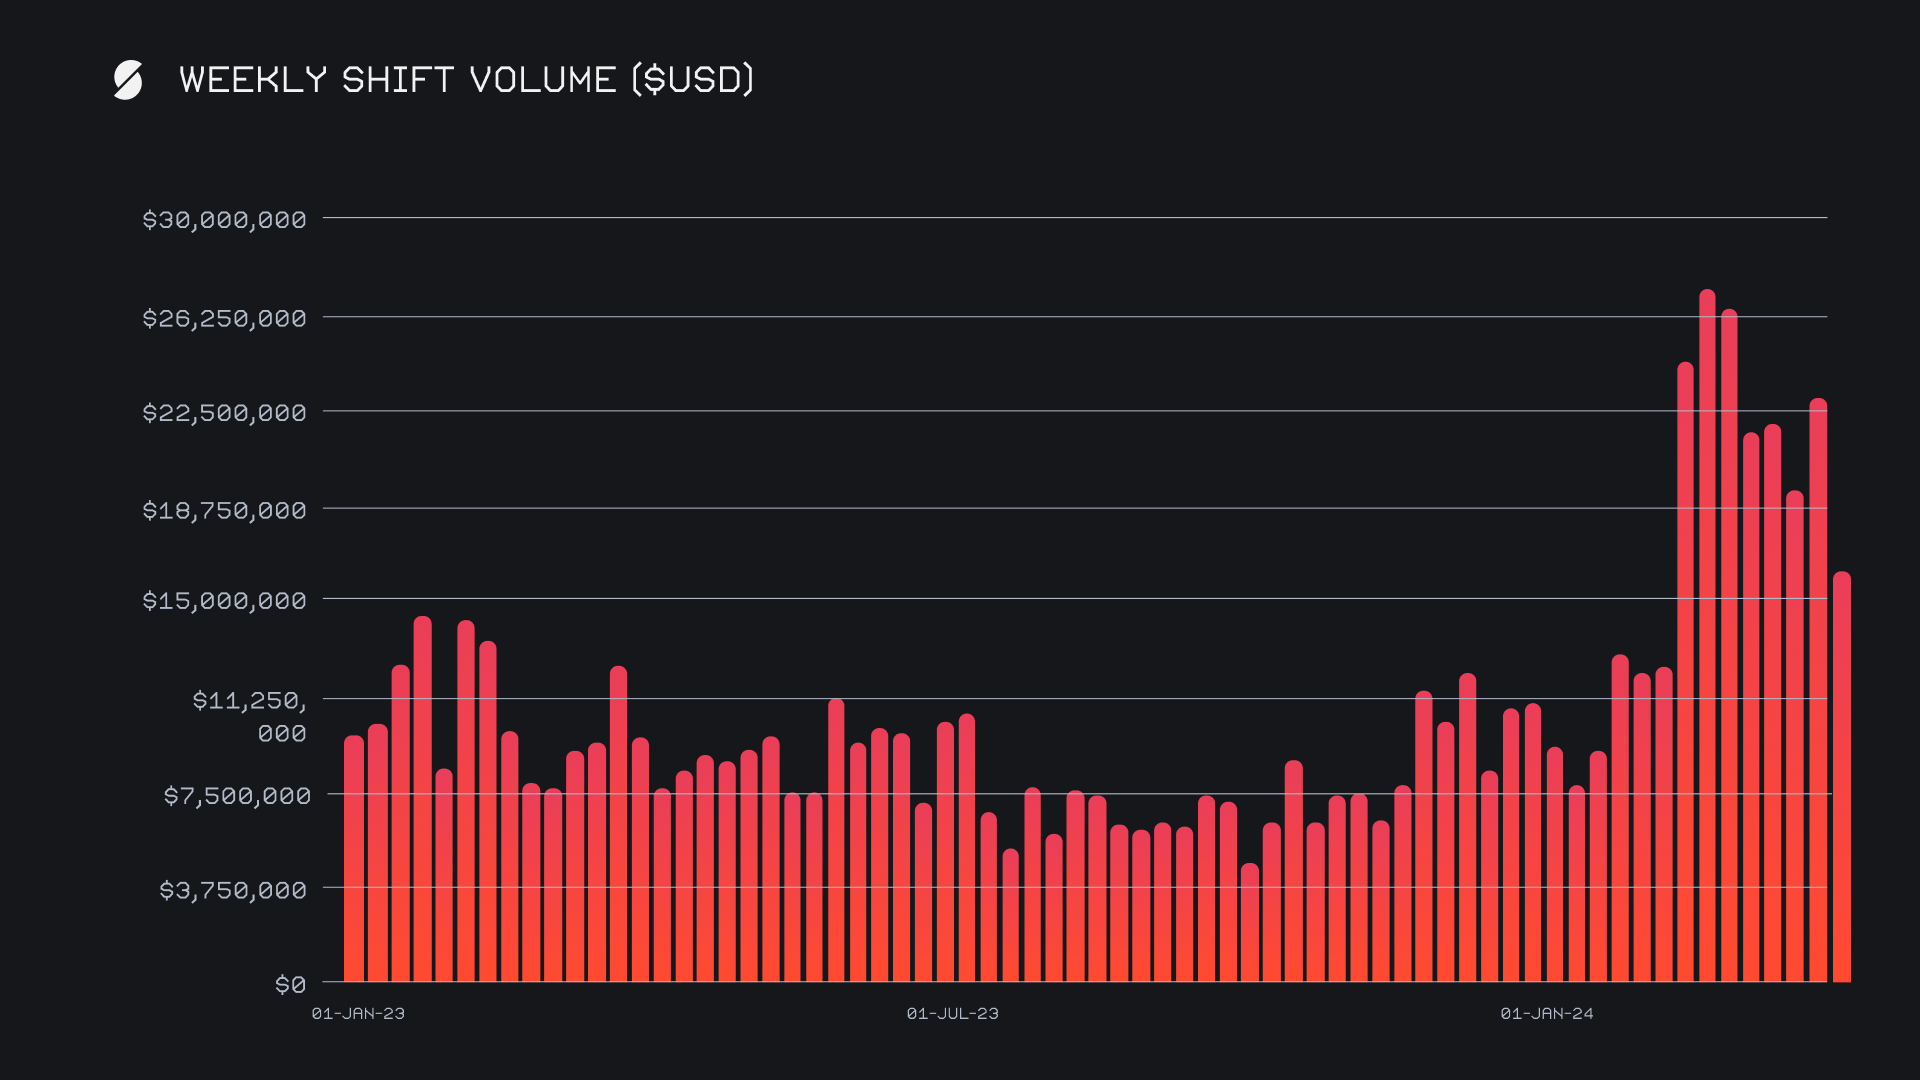
SideShift had a bit of a slower period as compared to the strength displayed in recent weeks, but still ended the week with a respectable gross volume of $17.0m (-25%). Our total shift count was also lower but decreased at a slower rate than volume - it ended with a gross count of 10,041, representing a weekly change of -14%. Despite this drop, it should be mentioned that this weekly count still sits ~20% higher than the weekly average seen through the first two months of 2024, and double that of the weekly averages seen in late summer 2023. Particularly, we continue to see the number of shifts on more our recently added networks expand.
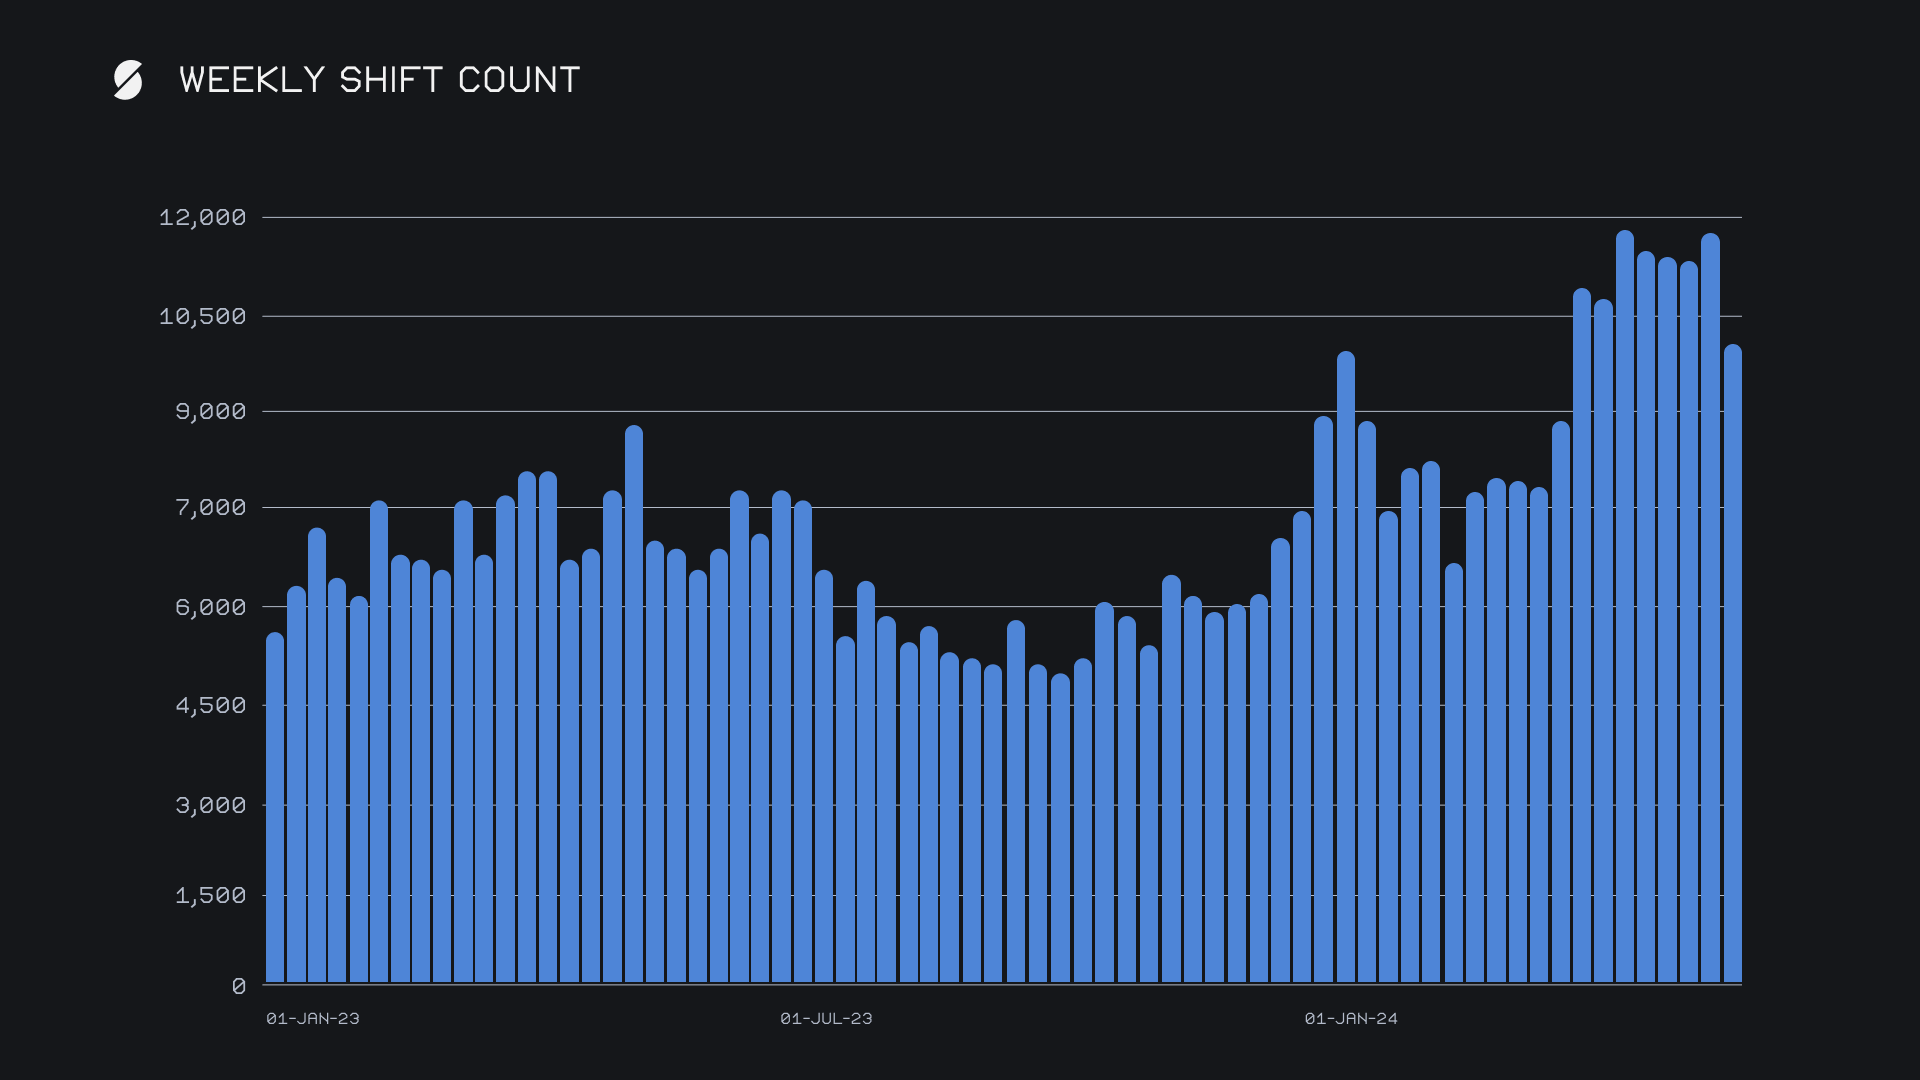
Our weekly gross volume and count combined to produce daily averages of $2.4m on 1,434 shifts, with an average shift size of $1.7k. These averages were most impacted by shifts completed directly on the site, which is where we noted a lesser amount of volume unfolding this week. Our top affiliates on the other hand remained quite steady, resulting in the growth of their overall proportion of the total.
SideShift’s top 5 coins by total volume (deposits + settlements) saw less attention than they have become used to in recent weeks. A combined total volume of $22.3m marks the lowest combined sum seen in the past 8 periods, a rise and fall which is notable in the chart below. With that being said, this was mainly a byproduct of the generally lower overall volume, as our top 5 still accounted for their typical ~65% of our total volume. None of our top coins were immune to this drawdown with all 5 seeing a doubt digit decrease in their weekly sums, but our top coin of BTC showed some resilience and was affected the least. It led all coins with a total volume of $7.6m (-10.3%), in addition to being both our most deposited and settled coin. This breakdown favored user settlements vs deposits by a measure of $3.8m to $2.8m, indicating that users were steadily stacking BTC as it rebounded off the $60k price mark. Just over a quarter of this volume came from SOL, as SOL/BTC uncharacteristically was the most popular shift pair for users for the second week in a row. The ETH/BTC pair however followed close behind, with a weekly total of $996k.
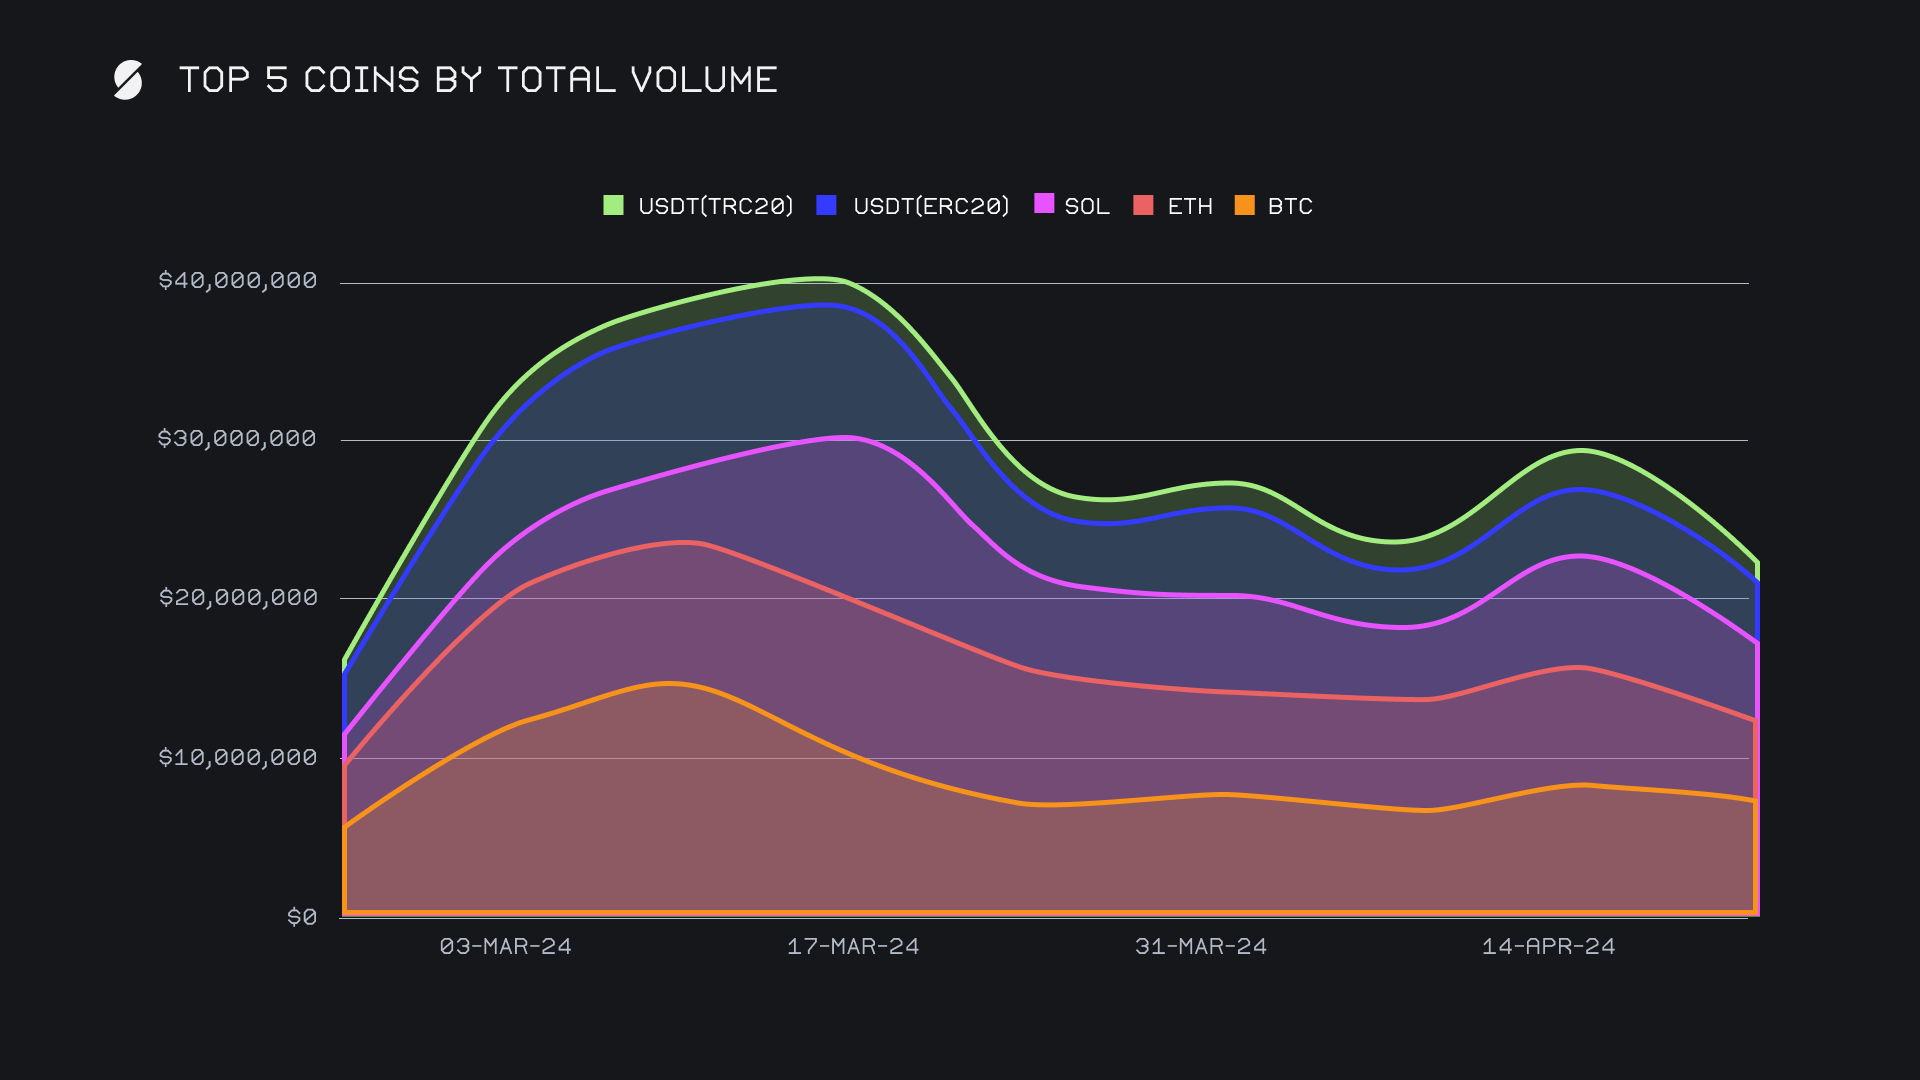
Second and third placed coins ETH and SOL had the largest pullbacks and both saw their total volume drop by more than 30%, although for different reasons. ETH was hit hardest due to a sudden halt in user demand, resulting in its settlement total falling by -46% for $1.8m. Meanwhile, ETH user deposits remained mostly consistent and only changed a minor -5% for $2.3m - as mentioned before, just shy of half of this sum was shifted to BTC. Conversely, SOL opposed the behavior of ETH and it was noted that the decrease came from a lesser amount of user deposits. This was following a week where SOL price was crashing, and users were rushing to other coins, BTC in particular. This trend of users shifting out of SOL did continue but most definitely slowed, possibly as a result of the market recovering. SOL user deposits dropped by -35.6% for $2.3m, as compared to a settlement total which declined by a far less significant -5.8% for $1.5m.
One constant this week was the popularity of users shifting to BTC from a multitude of different coins. The recent launch of Runes may have played a role in this rush to BTC, as it remains a dominant topic of discussion in the news. Regardless of the cause, the steady flow to BTC from various sources resulted in BTC being one of the few coins to not see a decline in its settlement total. Aside from the top coins already mentioned, several others fell into this category. For example, BNB saw 60% ($142k) of its volume being shifted to BTC, along with other coins such as DOT, USDC (sol) and ATOM following a similar pattern, albeit with lower overall amounts.
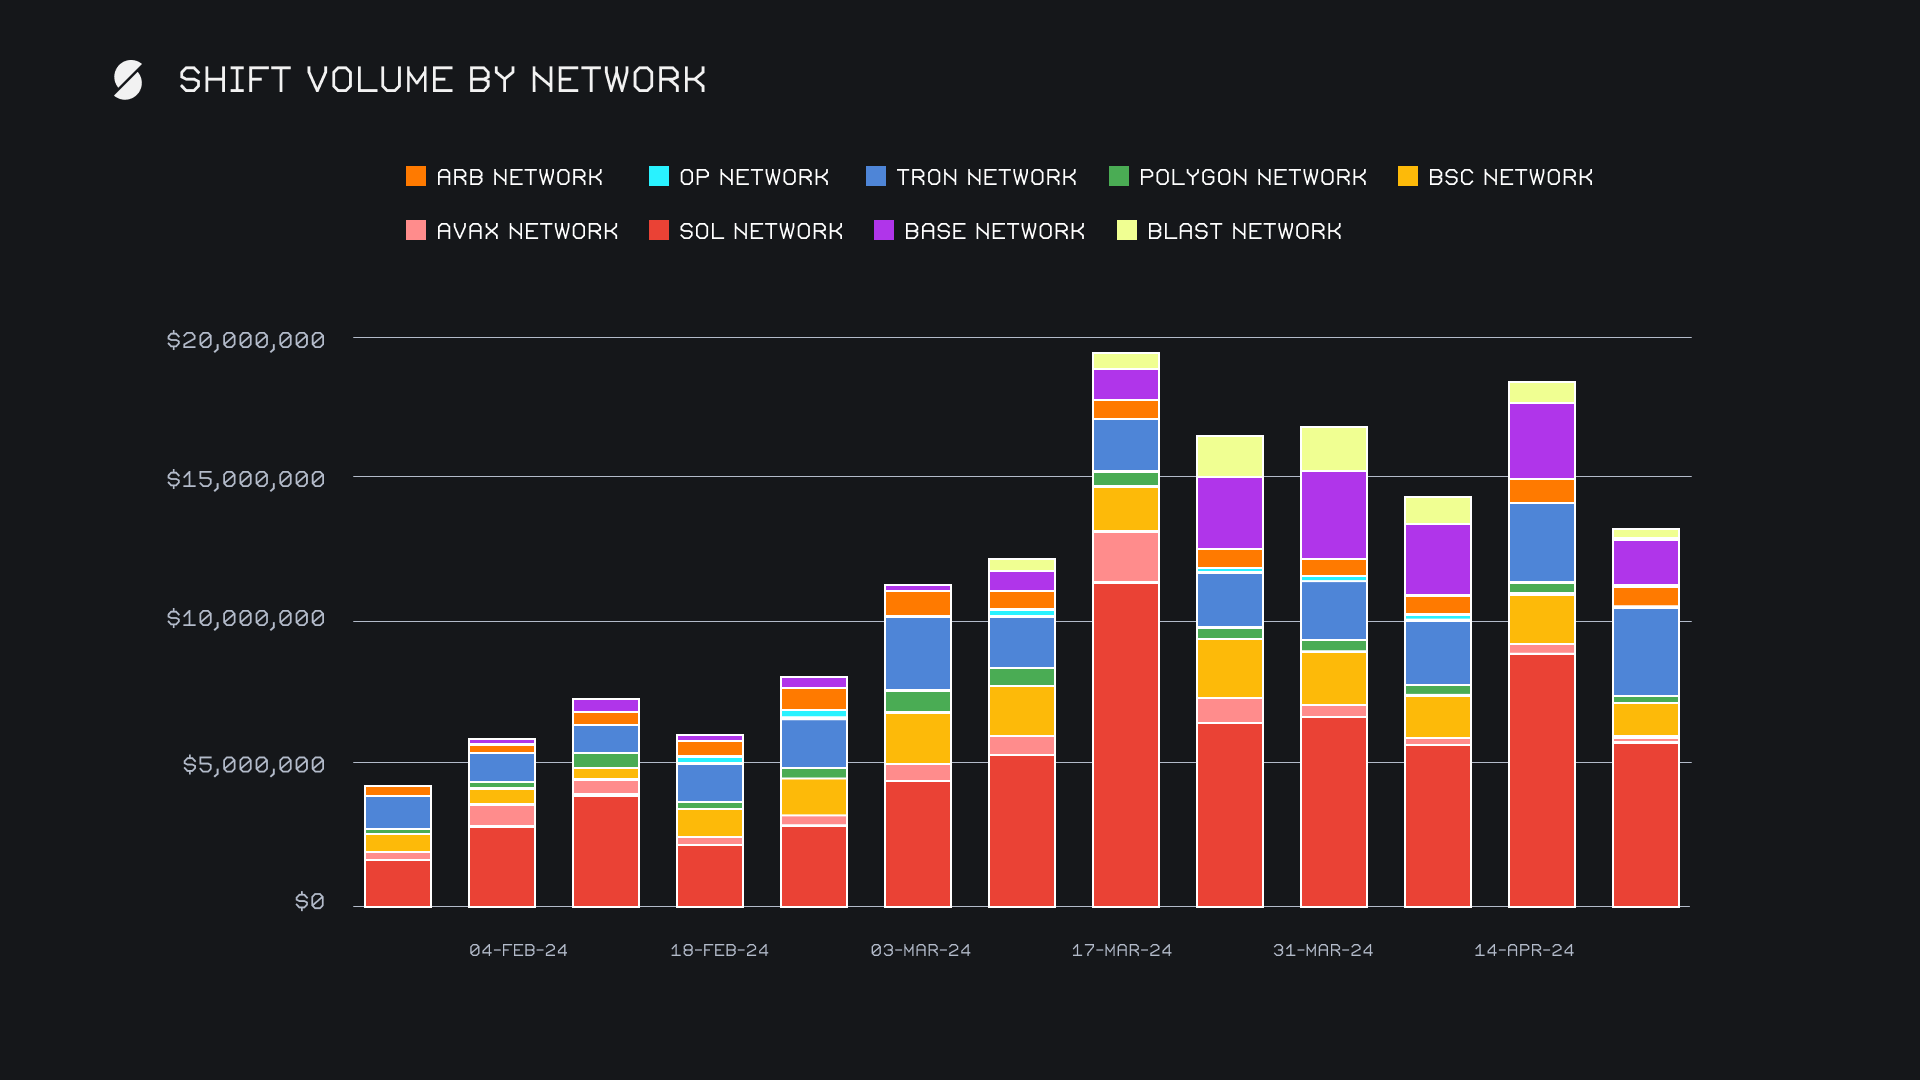
A quick look at alternate networks to ETH shows an overall nominal decline, but maintenance of their combined relative strength. All together they were involved in 38.8% of weekly shift volume, as compared to the Ethereum networks proportion of 34.9%. As usual and in firm command of this group was once again the Solana network, primarily due to heavy shifting of the native SOL token, but also the recent uptick in shifting of stablecoins on SOL. The Solana network ended with a total $5.9m (-34.2%), impacted most heavily by the aforementioned drop in deposits. Following in second was the Tron network, being one of only two alternate networks to see growth in its weekly volume. A total volume of $3.0m (+11.9%) was enough to secure second place, thanks to $1.9m in shifting of USDT (TRC-20). The Base and BSC networks ranked in third and fourth places, with respective totals of $1.7m (-37.1%) and $1.2m (-31.6%). Although hefty declines, these still sat much higher than networks such as Blast and Avalanche, which both saw volumes plummet by more than -60%, and produce relative sums of $248k and $114k.
Affiliate News
SideShift’s top affiliates came together for a collective $3.8m, representing only a slight -3.7% change from last week’s sum. Our former top affiliate was leapfrogged this week, thanks to the new number one enjoying a +45% jump in weekly volume for $1.1m. Second and third placed affiliates still had decent performances and ended with respective totals of $1.0m and $969k. Our second placed affiliate this week led the pack in terms of shift count, with a solid weekly count of 853 shifts.
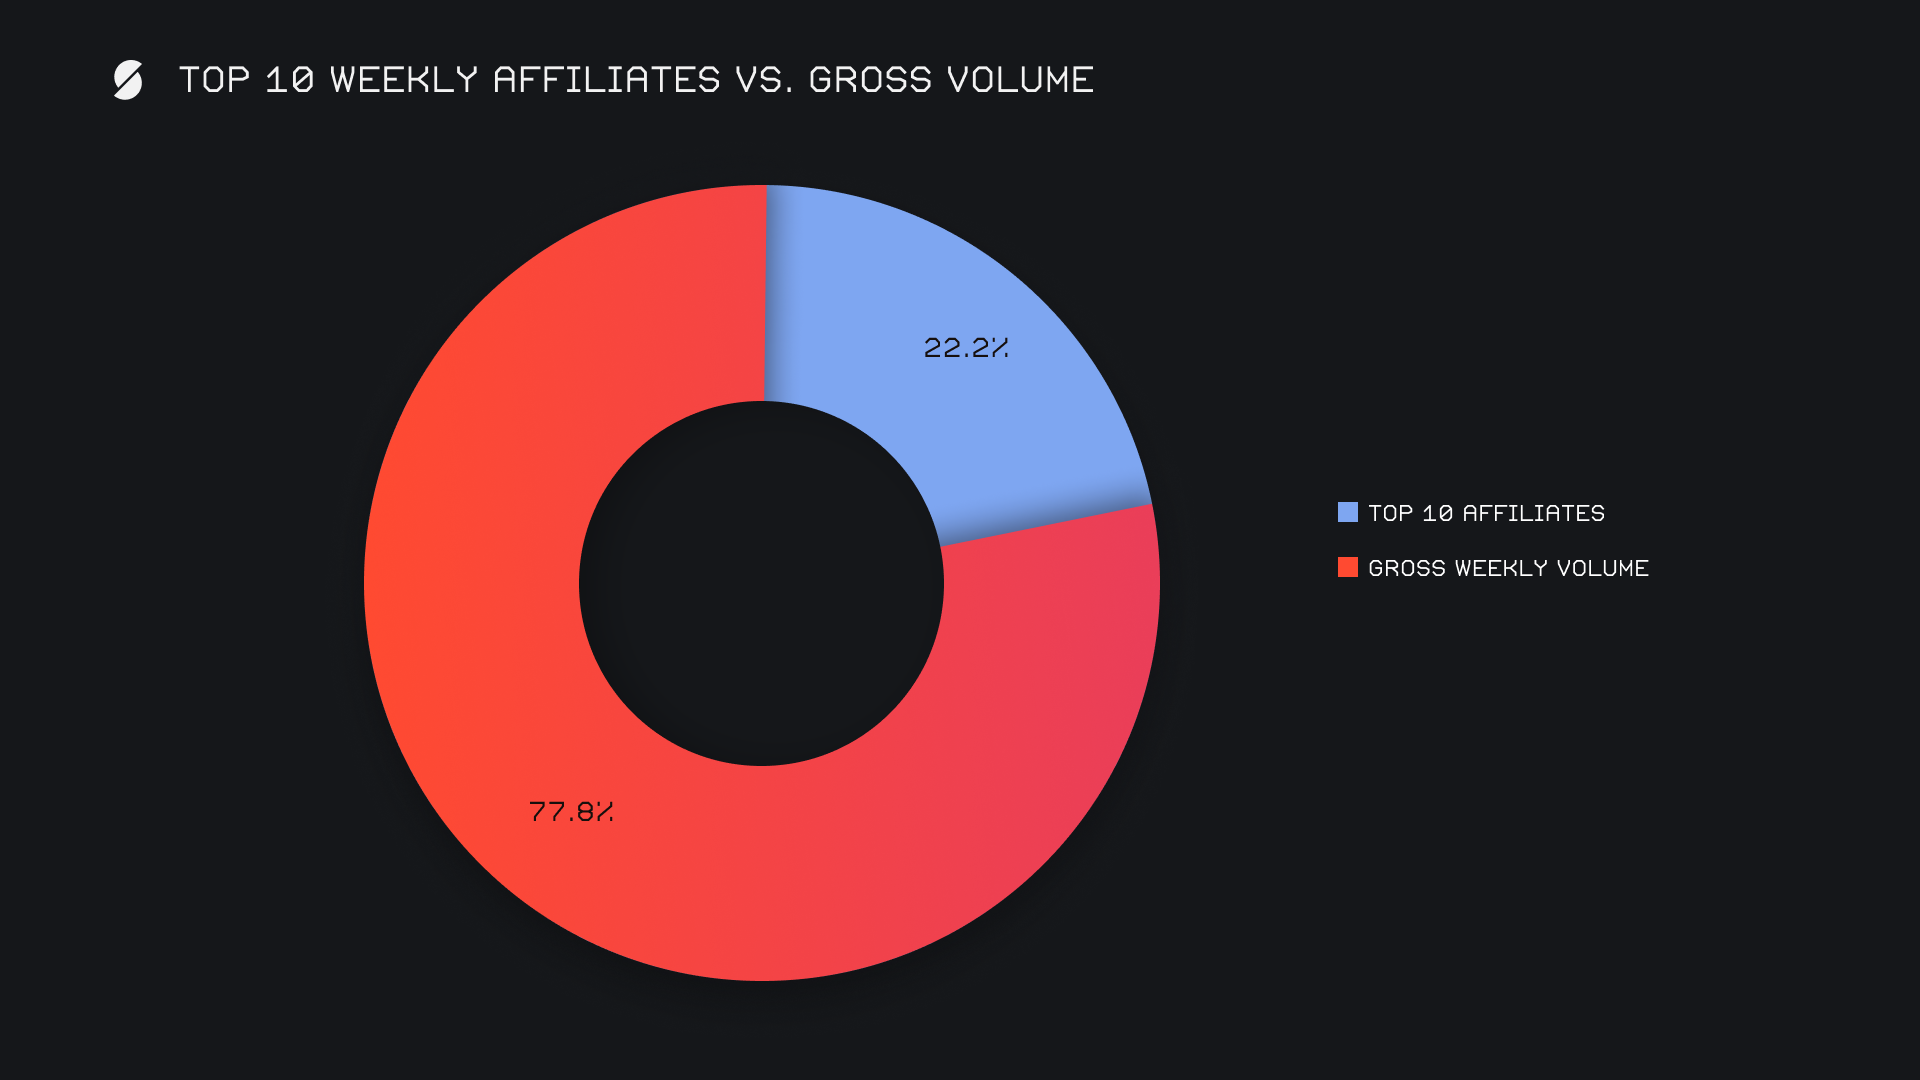
All together, our top affiliates accounted for 22.2% of our weekly volume, +5% higher than last week’s proportion.
That’s all for now. Thanks for reading and happy shifting.

