SideShift.ai Weekly Report | 18th - 24th July 2023
SideShift Weekly Report: Most popular coins, XAI staking performance, and other interesting insights about SideShift.ai and the cryptocurrency space. Welcome to the sixty-fourth edition of the weekly stats report - your one-stop shop for all things SideShift.ai.

Welcome to the sixty-fourth edition of the weekly stats report - your one-stop shop for all things SideShift.ai.
XAI Token Market Update
This week SideShift token (XAI) moved within the 7 day range of $0.1089 / $0.1151, and the time of writing is currently sitting at a price of $0.1136. The current market cap of XAI is $14,168,022 (+0.6%) as denoted on our Dune Dashboard.
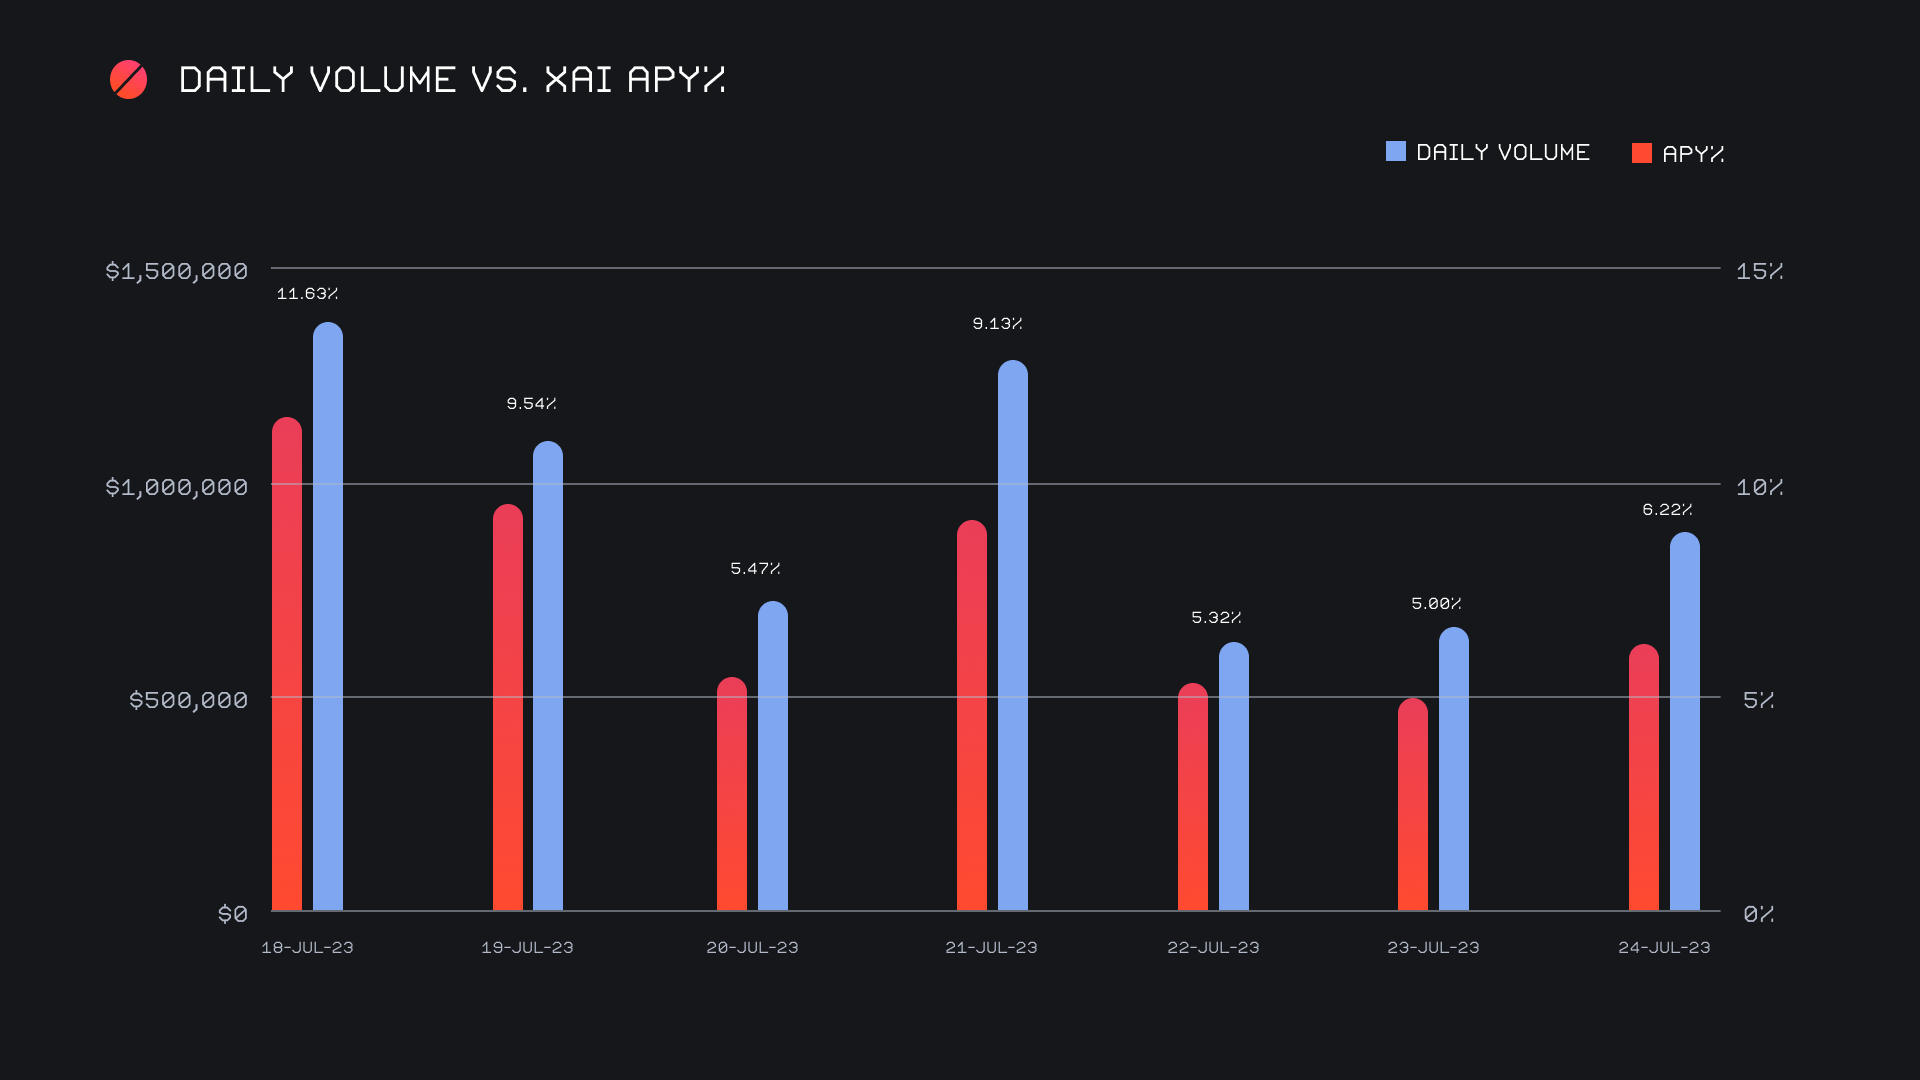
XAI stakers were rewarded with an average APY of 6.78% this week, with a daily rewards high of 33,278.13 XAI (an APY of 11.63%) being distributed to our staking vault on July 18th, 2023. This was following a daily volume of $1.4m. This week XAI stakers received a total of 152,151.68 XAI or $17,039.01 USD in staking rewards.
An additional 50 ETH was added to our treasury this week, and the current total is sitting at a value of $5.2m. Users are encouraged to follow along with live treasury updates directly on DeBank.
Additional XAI updates:
Total Value Staked: 108,455,193 XAI (+0.1%)
Total Value Locked: $12,365,164 (+1.4%)
General Business News:
This week turned out to be a largely uneventful one, with the majority of coins experiencing sideways chop in prices. A few select coins such as DOGE and MKR went against the grain, and enjoyed a nice ~20% pump.
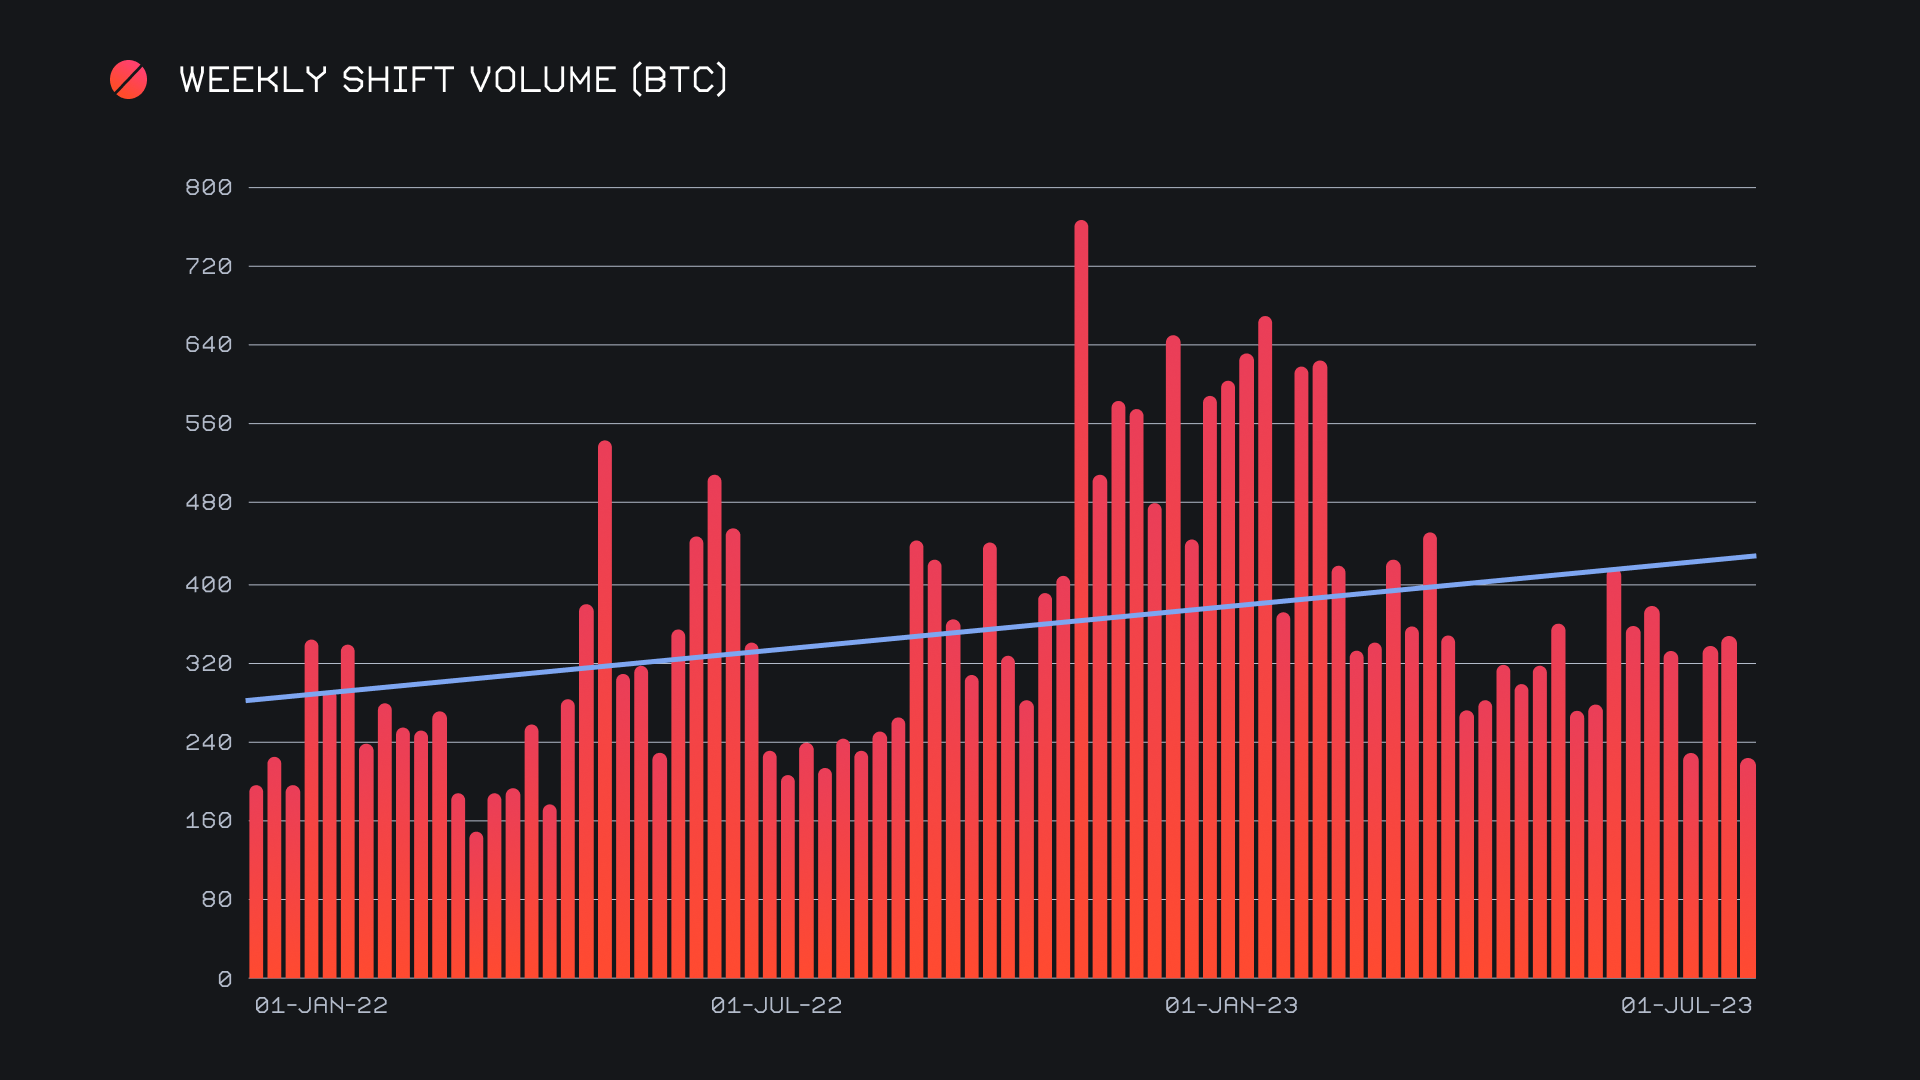
Following a very strong showing which was outlined in the previous report, this week SideShift had a slower overall performance. We ended the period with a gross volume of $6.7m (-37.2%) alongside a shift count of 5,865 (-8.2%). The decline in large scale BTC shifts resulted in volume falling off sharply, while impacting gross shift count to a far lesser extent. Together, these figures combined to produce daily averages of $951k on 838 shifts. When denoted in BTC, our weekly volume amounted to 223.49 BTC (-35.4%).
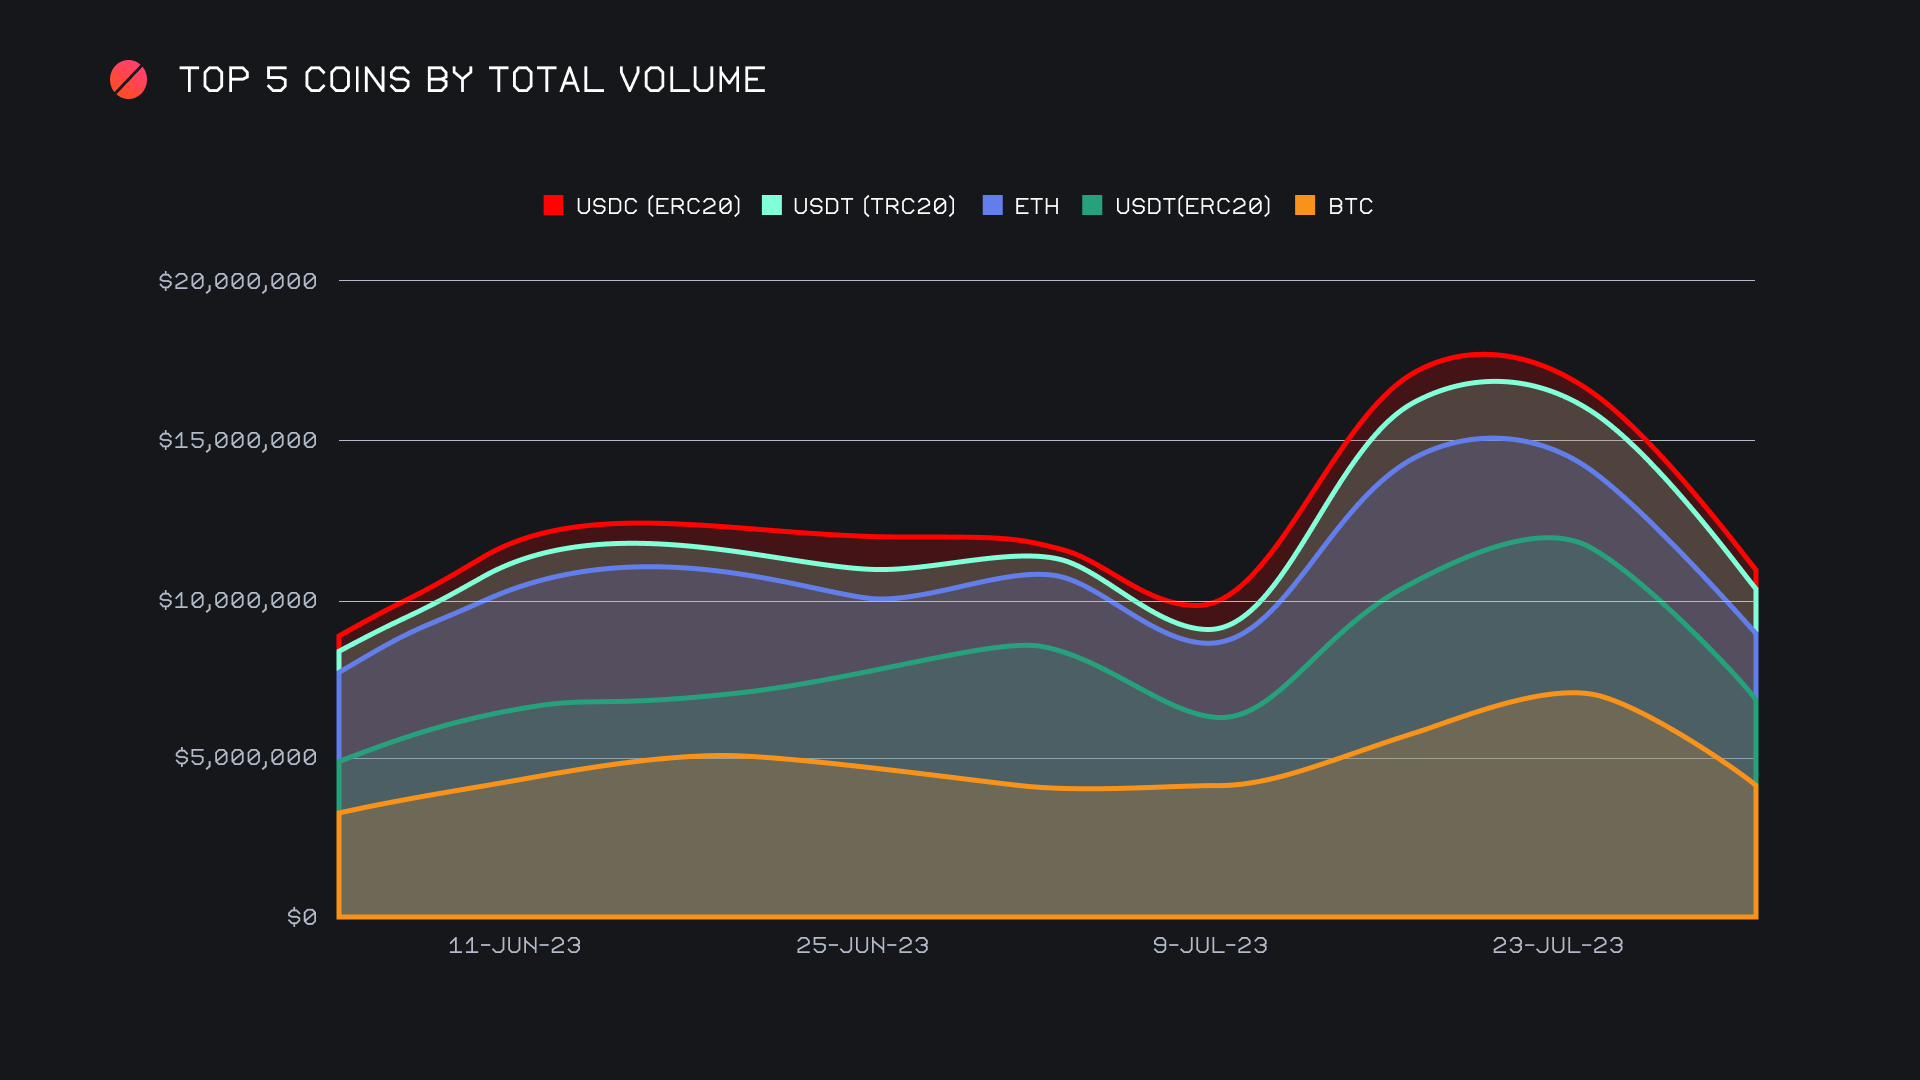
BTC remained the center of shifting for users even while having the second highest volume drawdowns among our top 5 coins. It did so with a total volume (deposits + settlements) of $4.2m, which was a sizable decline of 41.1% from the previous week. Although this was a steep dropoff, it still sat ~58% higher than the next coin with highest volume, which was USDT (ERC-20) with $2.6m. In recent months the large-scale BTC shifts tend to come from the BTC / USDT (ERC-20) pair in particular. This week, however, saw the pair garner nearly $800k less shift volume than last week, thereby contributing to the total shift volume decline for both coins. That being said, it still remained the week’s most popular shift pair, now for the sixth consecutive week, with $1.1m. A large portion of these shifts coming from our integrations.
As is typically the case, the top 5 coins were made up of BTC and ETH, together with our three most popular stablecoins. Of these, the only coin to see a weekly gain in shift volume was USDC (ERC-20). It sat fifth overall with a total volume of just $529k (+9.3%), nearly 3x less than the fourth placed coin, USDT (TRC-20). The rest of the top 5 saw volume declines ranging from 20-45%. Nevertheless, these top 5 combined to account for more than 80% of the total weekly shift volume, which clearly signifies the intense concentration of shifting taking place among our top coins. It is also worth noting that this density in shifting came after a week which seemed to show that users were beginning to slowly branch out into alternate assets.
After experiencing 3 straight weeks with a deposit volume that exceeded $1m, this week user ETH deposits plummeted 45% for a sum of $568k. This still managed to be the second highest deposit volume of the week. You can note the decline in our top 5 coins in the chart below, most notably our top three of BTC, USDT (ERC-20), and ETH. It will be interesting to see how our top coins respond, as cumulatively they are now approaching multi month lows.
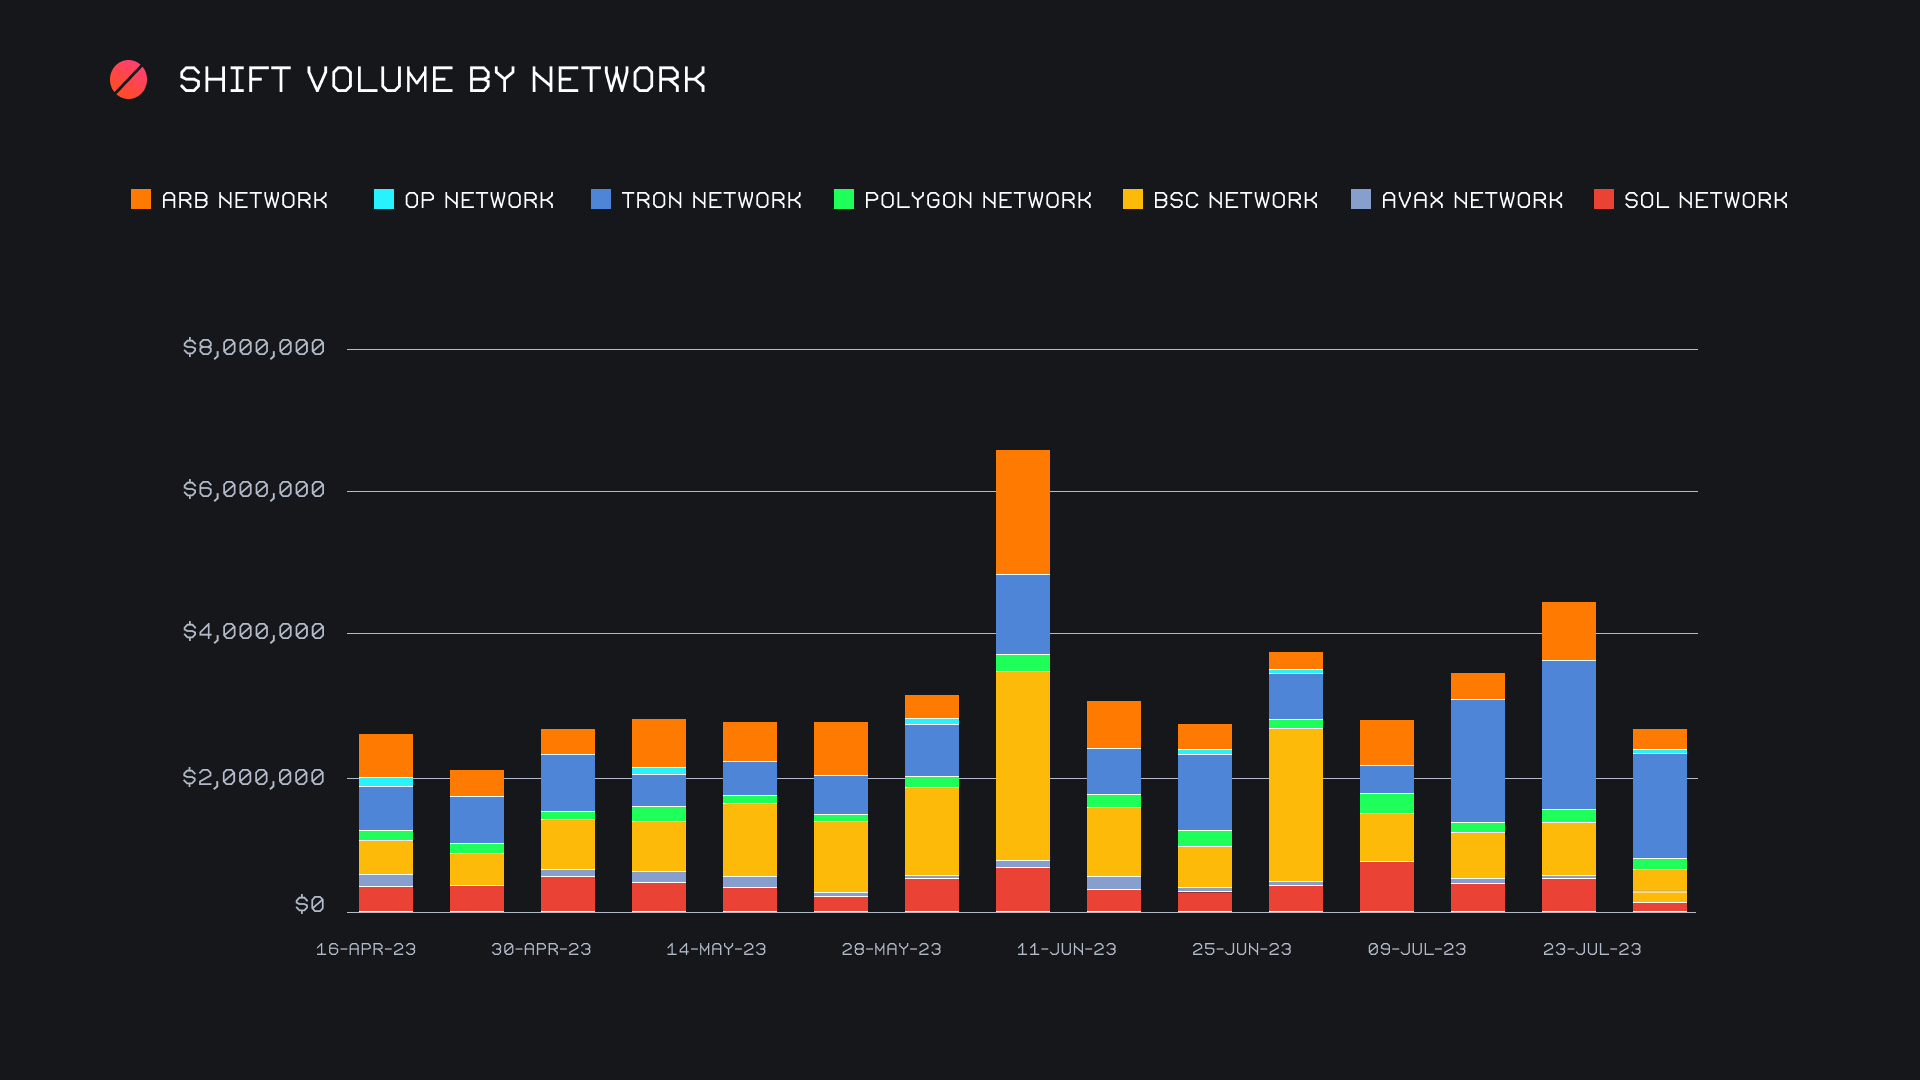
Alternate networks to ETH were no exception to the pullback in volume, as they cumulatively declined by ~40% as compared to last week. After breaching $4m in the previous report, this week they combined to sum $2.7m. Of this, the Tron network accounted for an overwhelming $1.5m, making it the true exception in this group. This was driven by a fairly even split of deposits and settlements for USDT (TRC-20), which alone accounted for a dominant 95% of the Tron volume.
Other networks saw pullbacks in volume exceeding 60% in some instances. Last week’s runner up, the Arbitrum network, fell from $800k last week to just $280k this week (-65%). The Binance Smart Chain (BSC) network had a similar story, as it fell by 40.6% for a net $424k. Keep in mind that the majority of shifting on these alternate neworks comes from stablecoin shifting. Meanwhile, total volume taking place on the ETH network jumped from its usual 37% to nearly 50% this week. What this tells us is that the larger ETH network is far less affected by slow periods as compared to these alternate networks.
Affiliate News
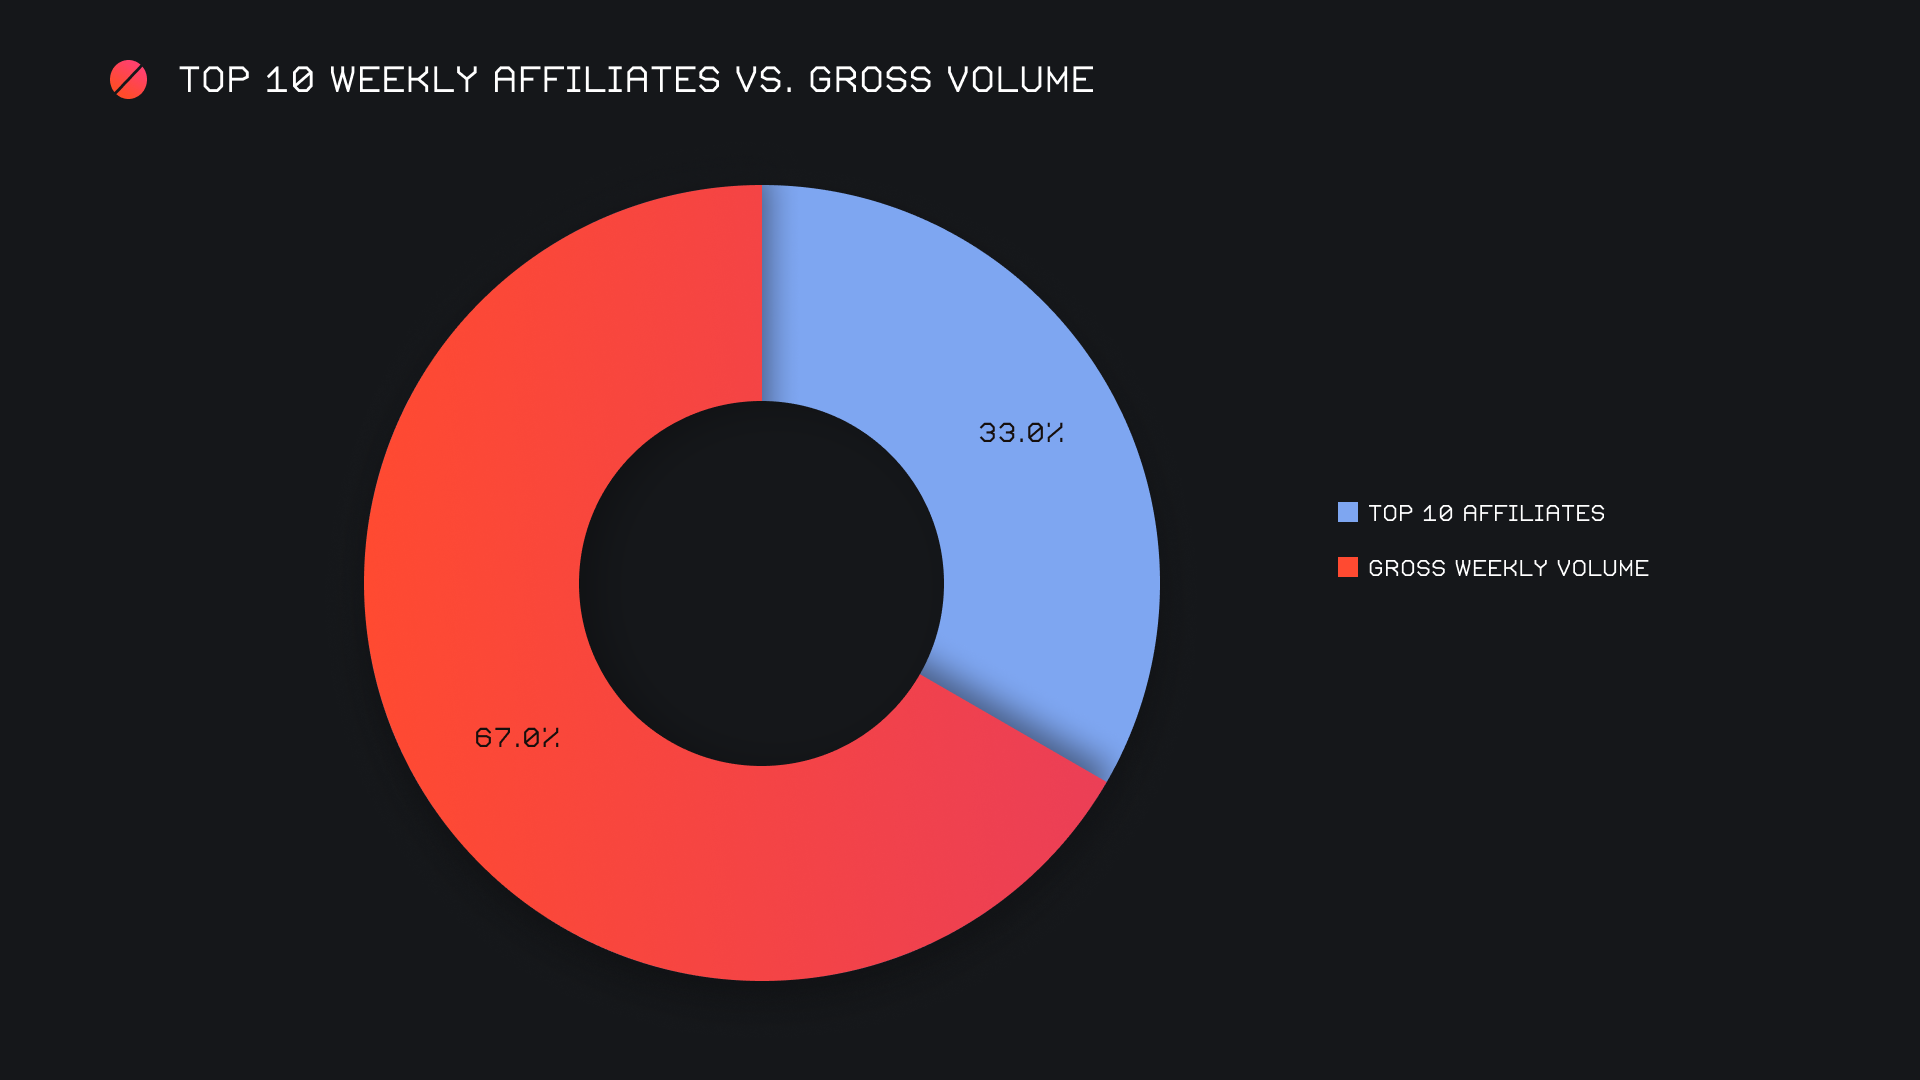
Our top 10 affiliates had a very good week, particularly when compared to the general dip in overall volume. Together, they combined for $2.2m (-8.2%) with a total shift count of 2,082 (-18.4%). This is quite impressive considering the significant declines seen elsewhere. This consistency is largely due to the performance of our top affiliate, which alone represented 16.7% of our weekly volume.
Overall, the top 10 accounted for 33% of our weekly volume, and 35% of our weekly count, reaching some of the highest proportions seen so far this year.
That’s all for now. Thanks for reading, happy shifting and we’ll see you next time.

