SideShift.ai Weekly Report | 20th - 26th June 2023
SideShift Weekly Report: Most popular coins, XAI staking performance, and other interesting insights about SideShift.ai and the cryptocurrency space. Welcome to the sixtieth edition of the weekly stats report - your one-stop shop for all things SideShift.ai.
Welcome to the sixtieth edition of the weekly stats report - your one-stop shop for all things SideShift.ai.
XAI Token Market Update
Throughout the week SideShift token (XAI) moved within the 7 day range of $0.1132 / $0.1202. At the time of writing, the price of XAI is sitting at a price of $0.1144 and has a current market cap of $14,261,379 (-1.8%) as denoted on our Dune Dashboard.
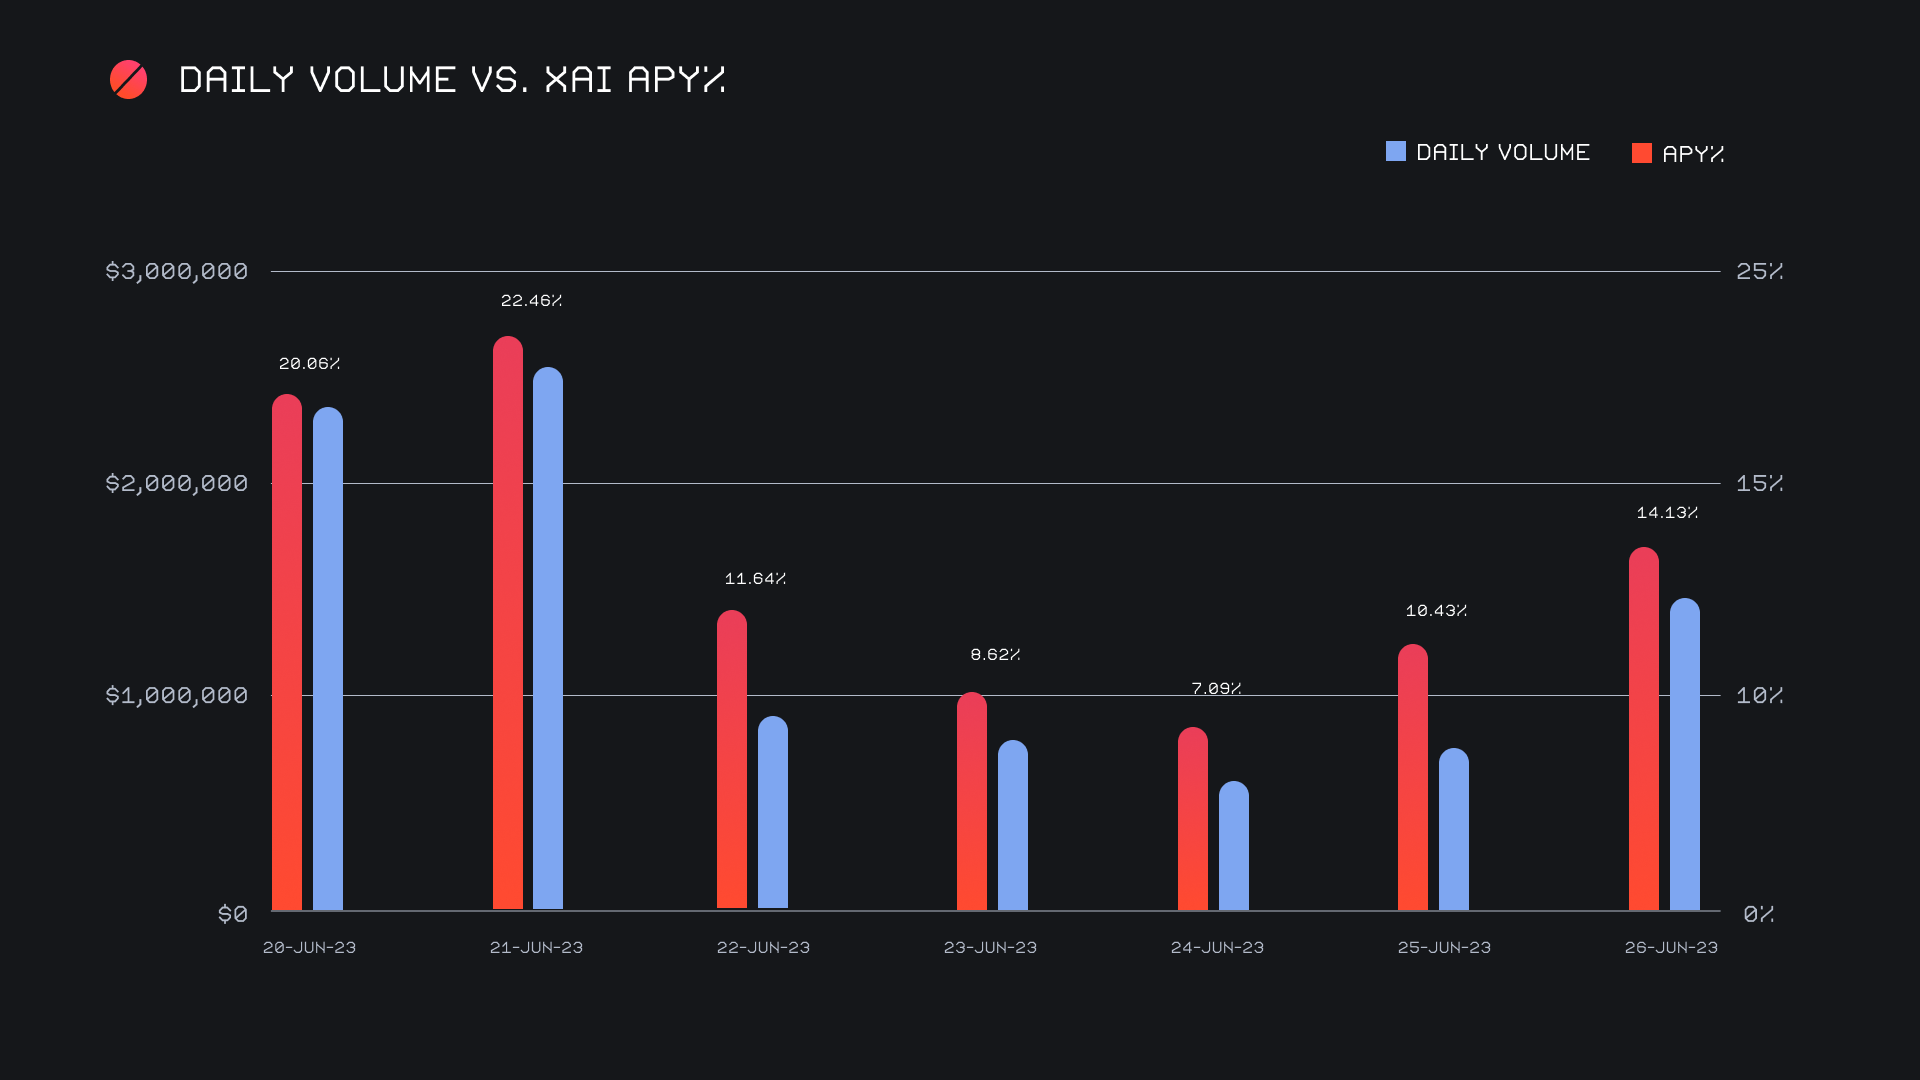
XAI stakers were rewarded with an average APY of 12.4% this week, with a daily rewards high of 58,568.31 XAI (an APY of 22.46%) being distributed to our staking vault on June 22nd, 2023. This was following a daily volume of $2.6m. This week XAI stakers received a total of 253,926.71 XAI, or $28,830.84 USD in staking rewards.
The price of 1 svXAI is now equal to 1.2071 XAI, representing a 20.71% accrual on stakers’ investments. A friendly reminder that the easiest way to participate in XAI staking is to shift directly to svXAI from any coin of your choice.
An additional 100 ETH was added to our treasury over the course of the week, bringing the current total to $4.37m. Users are encouraged to follow along with live treasury updates directly at zapper.fi.
Additional XAI updates:
Total Value Staked: 105,748,931 XAI (+0.2%)
Total Value Locked: $11,935,882 (-1.6%)
General Business News
This week began on a very bullish note with BTC’s price climbing ~15% to breach the $30k mark. Most other coins followed suit, while BCH had a mind of its own and exploded to more than double in price.
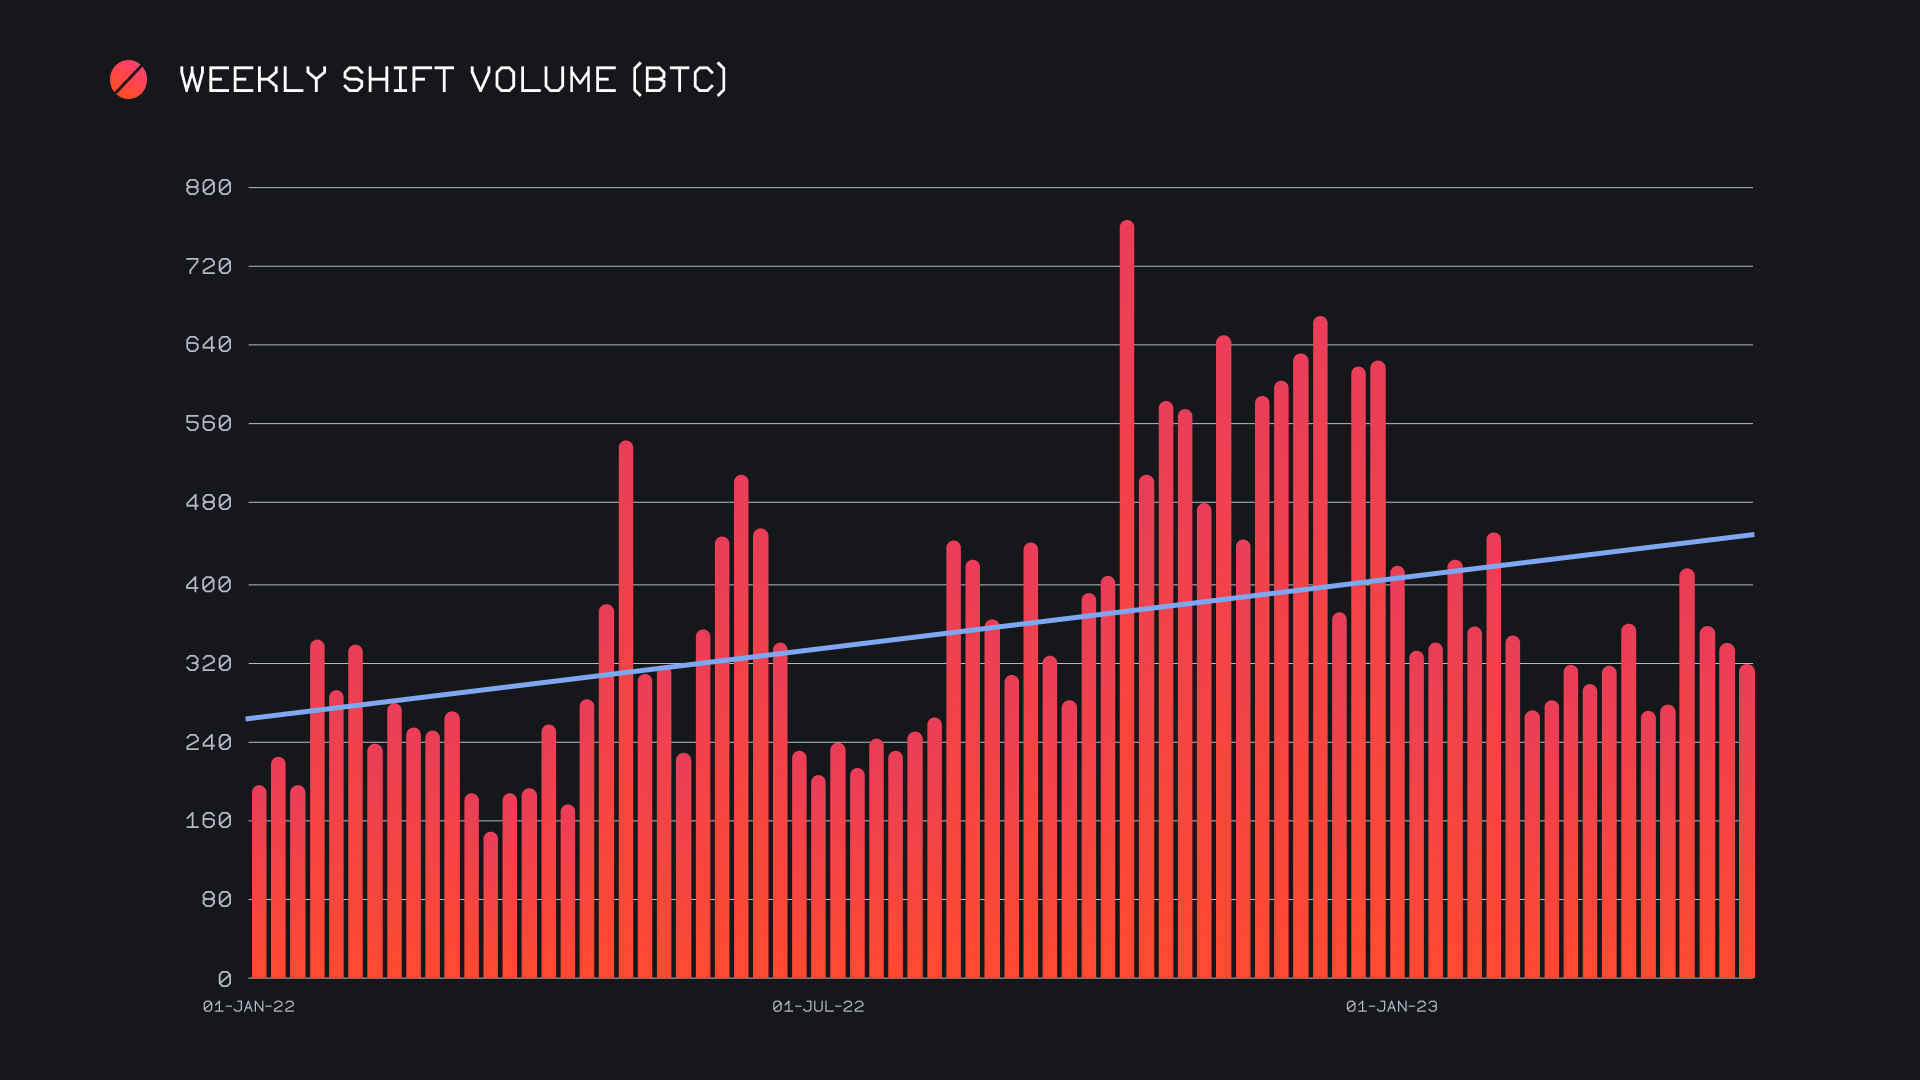
SideShift had a solid week, finishing the period with a gross volume of $9.4m (+6.8%) alongside a shift count of 7,636 (+12.4%). These two figures combine to produce daily averages of $1.4m on 1,091 shifts, a daily average approximately $90k higher than last week. When denoted in BTC, this week’s volume totalled 316.62 BTC (-6.1%). Despite our weekly volume increasing in USD terms, the BTC denomination saw a decrease due to the sharp rise in BTC’s price.
For several months now BTC has remained the focal point of shift action on SideShift, generating the majority of both shift volume and count. This week however saw stablecoins finish atop the rankings, with USDT (ERC-20) being front and center. It finished as the week’s most shifted coin with $4.3m by total volume (deposits + settlements), just narrowly squeaking by BTC which sat just $31k lower. A 34.8% weekly increase in USDT (ERC-20) volume can be accredited to a strong demand from users, as settlements accounted for just shy of $2m of this sum. Meanwhile, BTC remained steady enough, seeing only slight respective decreases in user deposits and settlements of -6.6% and -3%. In other words, it had a normal week, without encountering any of the major fluctuations in shift action that stablecoins did. It is interesting to note that USDT (ERC-20) is seeing such a demand during times of generally bullish price action. Perhaps this is an indicator of lingering fear in the market, with users not having faith that the upwards price action will be sustainable. You can note the clear upwards trend that USDT (ERC-20) has taken since the second week of June in the chart below.
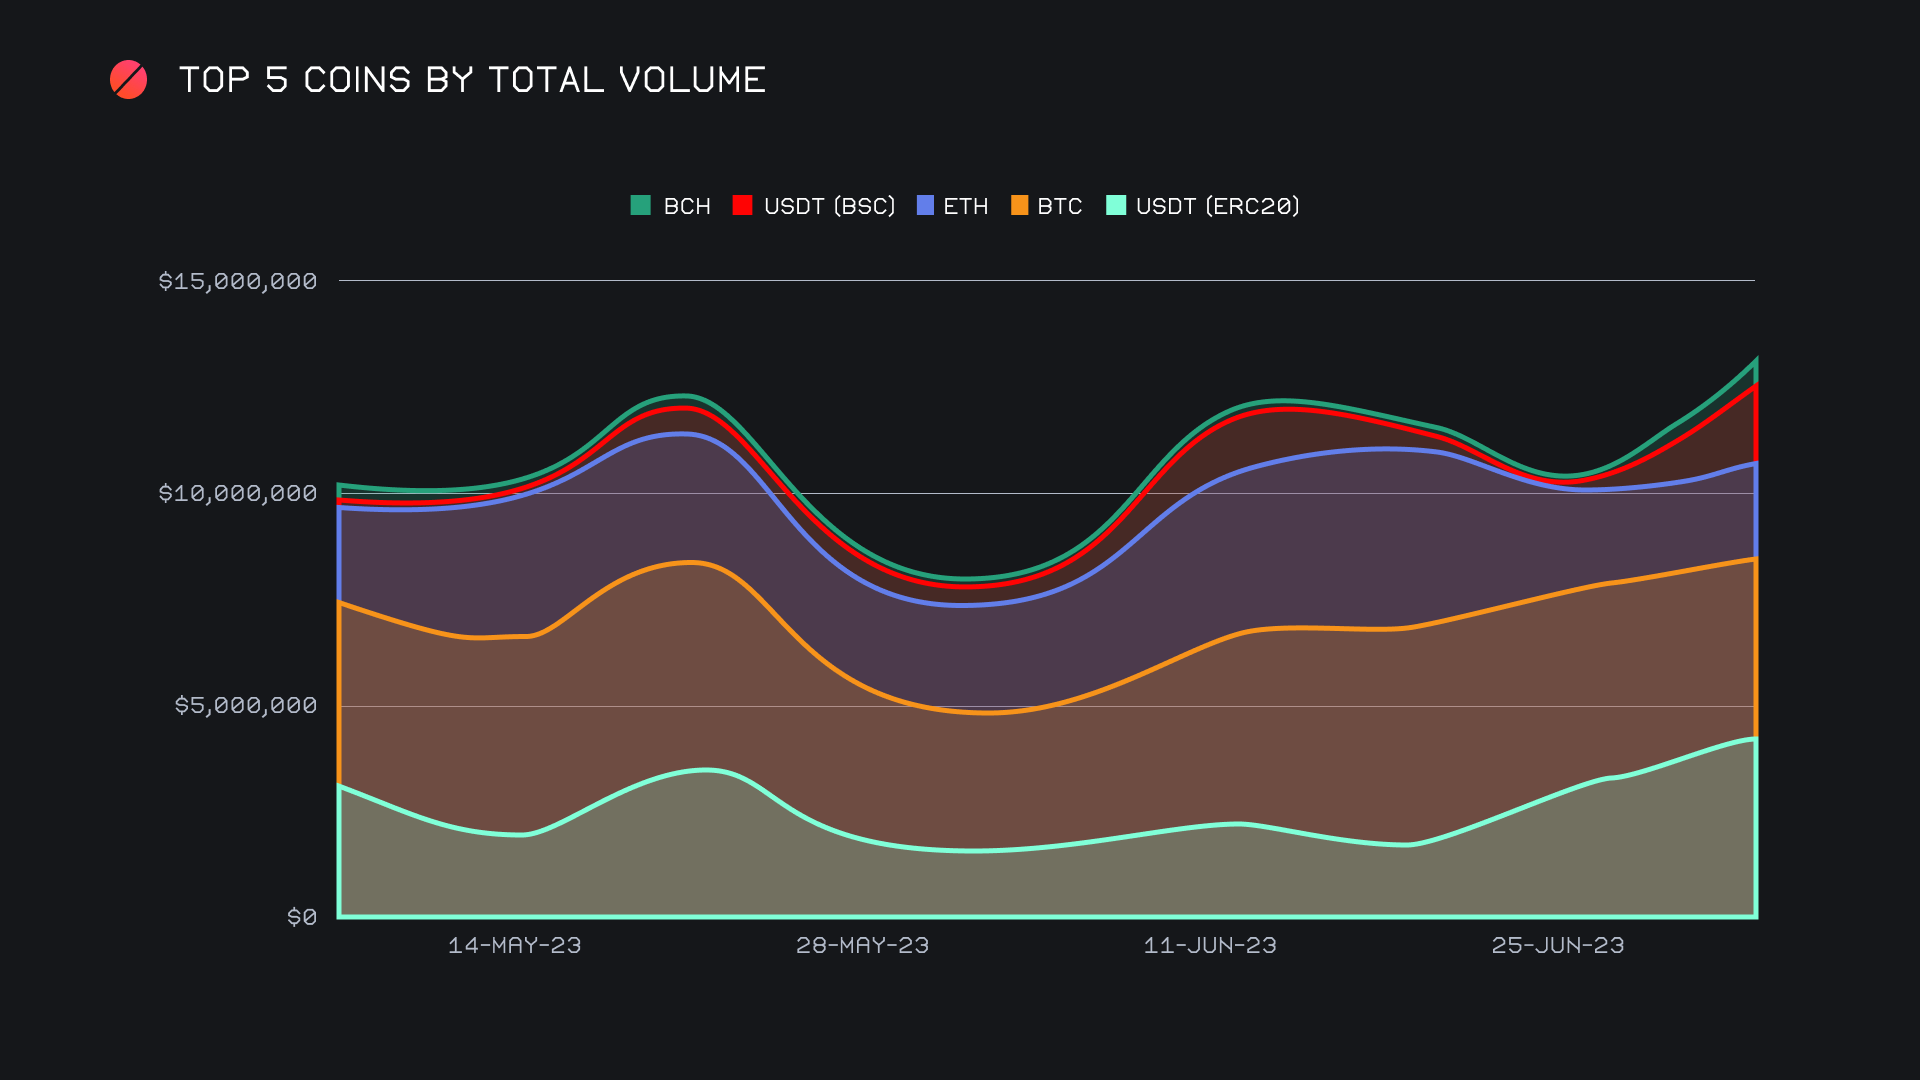
Although USDT (ERC-20) is clearly blazing the trail for stablecoins, a look at volume from all stablecoins combined shows a similar upwards path established within the past two weeks. Coinciding with the rush of USDT (ERC-20) settlements was an influx of USDT (BSC) deposits. With an approximate 11x growth rate, user deposits of USDT (BSC) rocketed to $904k, making it the week's second most deposited coin, second only to BTC. The next closest coin which saw an increase in user deposits was BCH, which sat 4 places lower with a far less volume of $226k (+196%). The core reason behind this unordinary spike was a large amount of USDT (BSC) / USDT (ERC-20) shifting which occurred as users bridged USDT across these networks. This pair alone accounted for the vast majority of the USDT (BSC) volume, totalling $807k. Although a strong performance it was still not enough to out-do the reigning top pair of BTC / USDT (ERC-20), which netted $898k.
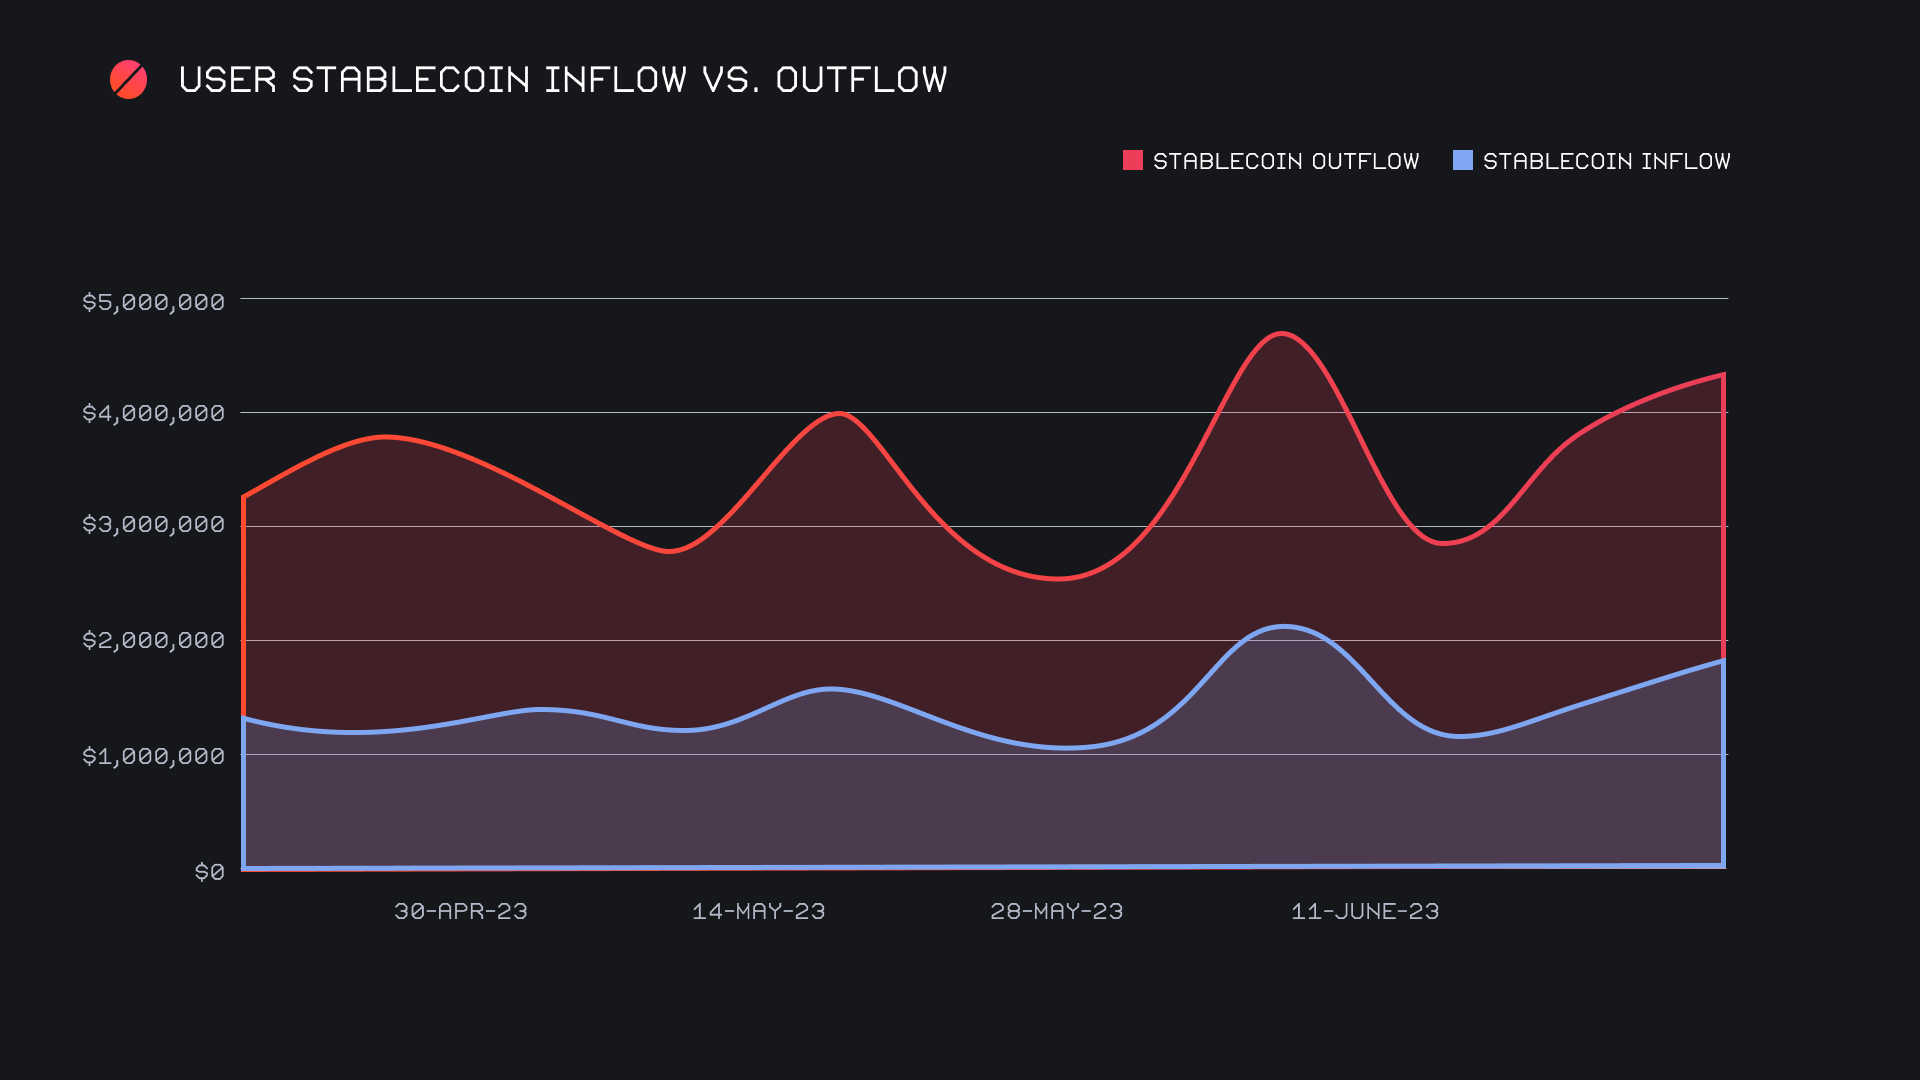
Stablecoin settlements (outflow) continue to outweigh inflow (deposits) quite substantially, this week exceeding inflow by $698k. Total stablecoin settlements netted just over $2.5m, approaching a near 10 week high. This furthers the notion that there is a lack of confidence in the market. You can visualize the rise in the below chart.
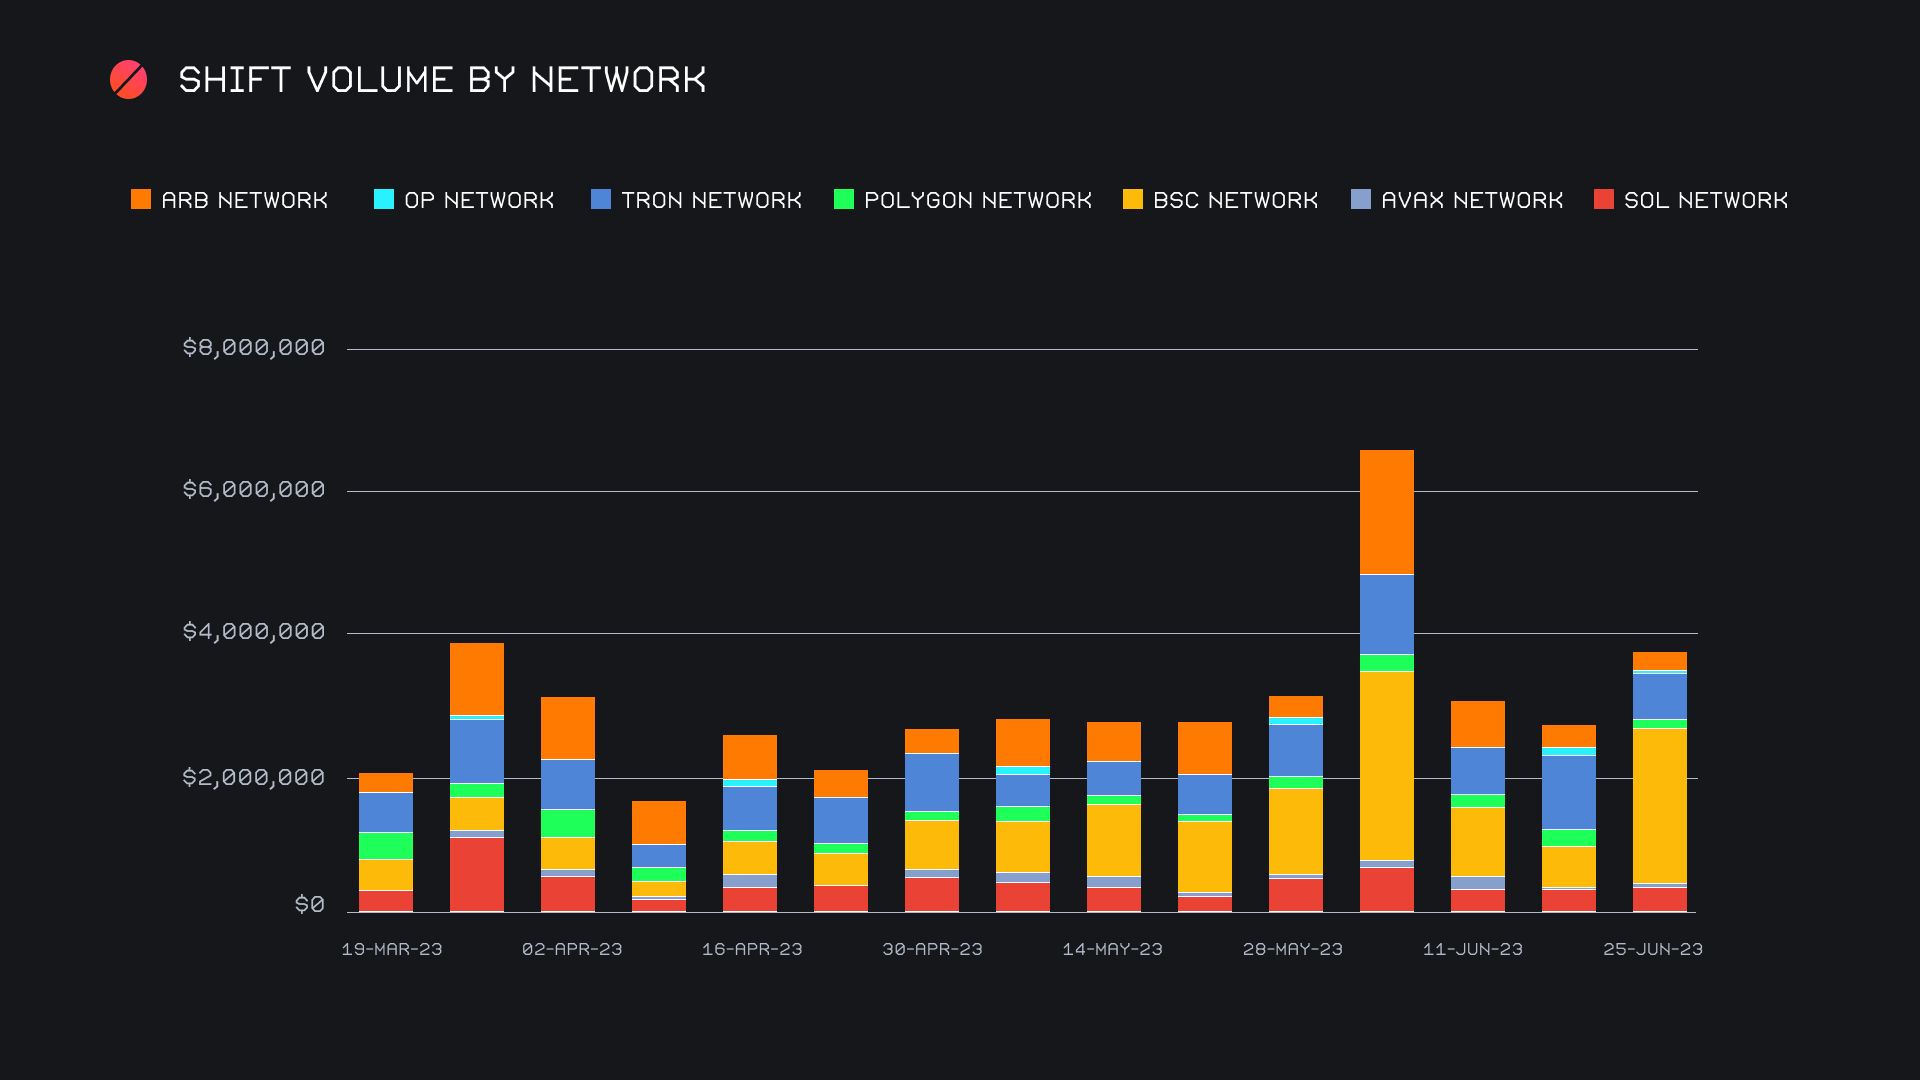
Alternate networks to ETH had a very strong week, closing in on the $4m mark. Binance Smart Chain (BSC) easily prevailed as the top network, standing head and shoulders above the others. The heavy shift action stemming from USDT on BSC catapulted this network into first place, as it finished with an impressive $2.1m (+277.5%). The Tron network on the other hand experienced the opposite, falling 39.1% for a second placed finish with $650k. In third place was the Solana network, which saw most of its volume come from its native coin as opposed to stablecoins, unlike the other top networks. The Solana network ended the week up 13.7% for a total $486k. The Arbitrum, Polygon, and Optimism networks all experienced quite steep declines in weekly volume, with a negative change ranging from 27-49%.
In listing news, SideShift added support for two new ERC-20 tokens, Render Token (RNDR) and MongCoin (MONG). Shifting to both RNDR and MONG are now live, from any coin of your choice.
Affiliate News
Our top 10 affiliates ended the week with a combined sum of ~$1.6m, a minor -1.6% change from the previous report. Shift count on the other hand rose by 21.2% for a sum of 2,280. The outcome of both volume and count can largely be traced to our top affiliate. This affiliate had an outstanding week compared to other affiliates, with its volume more than 13x higher than second place. It accounted for 13.9% of our weekly volume, and 19.8% of our weekly count.
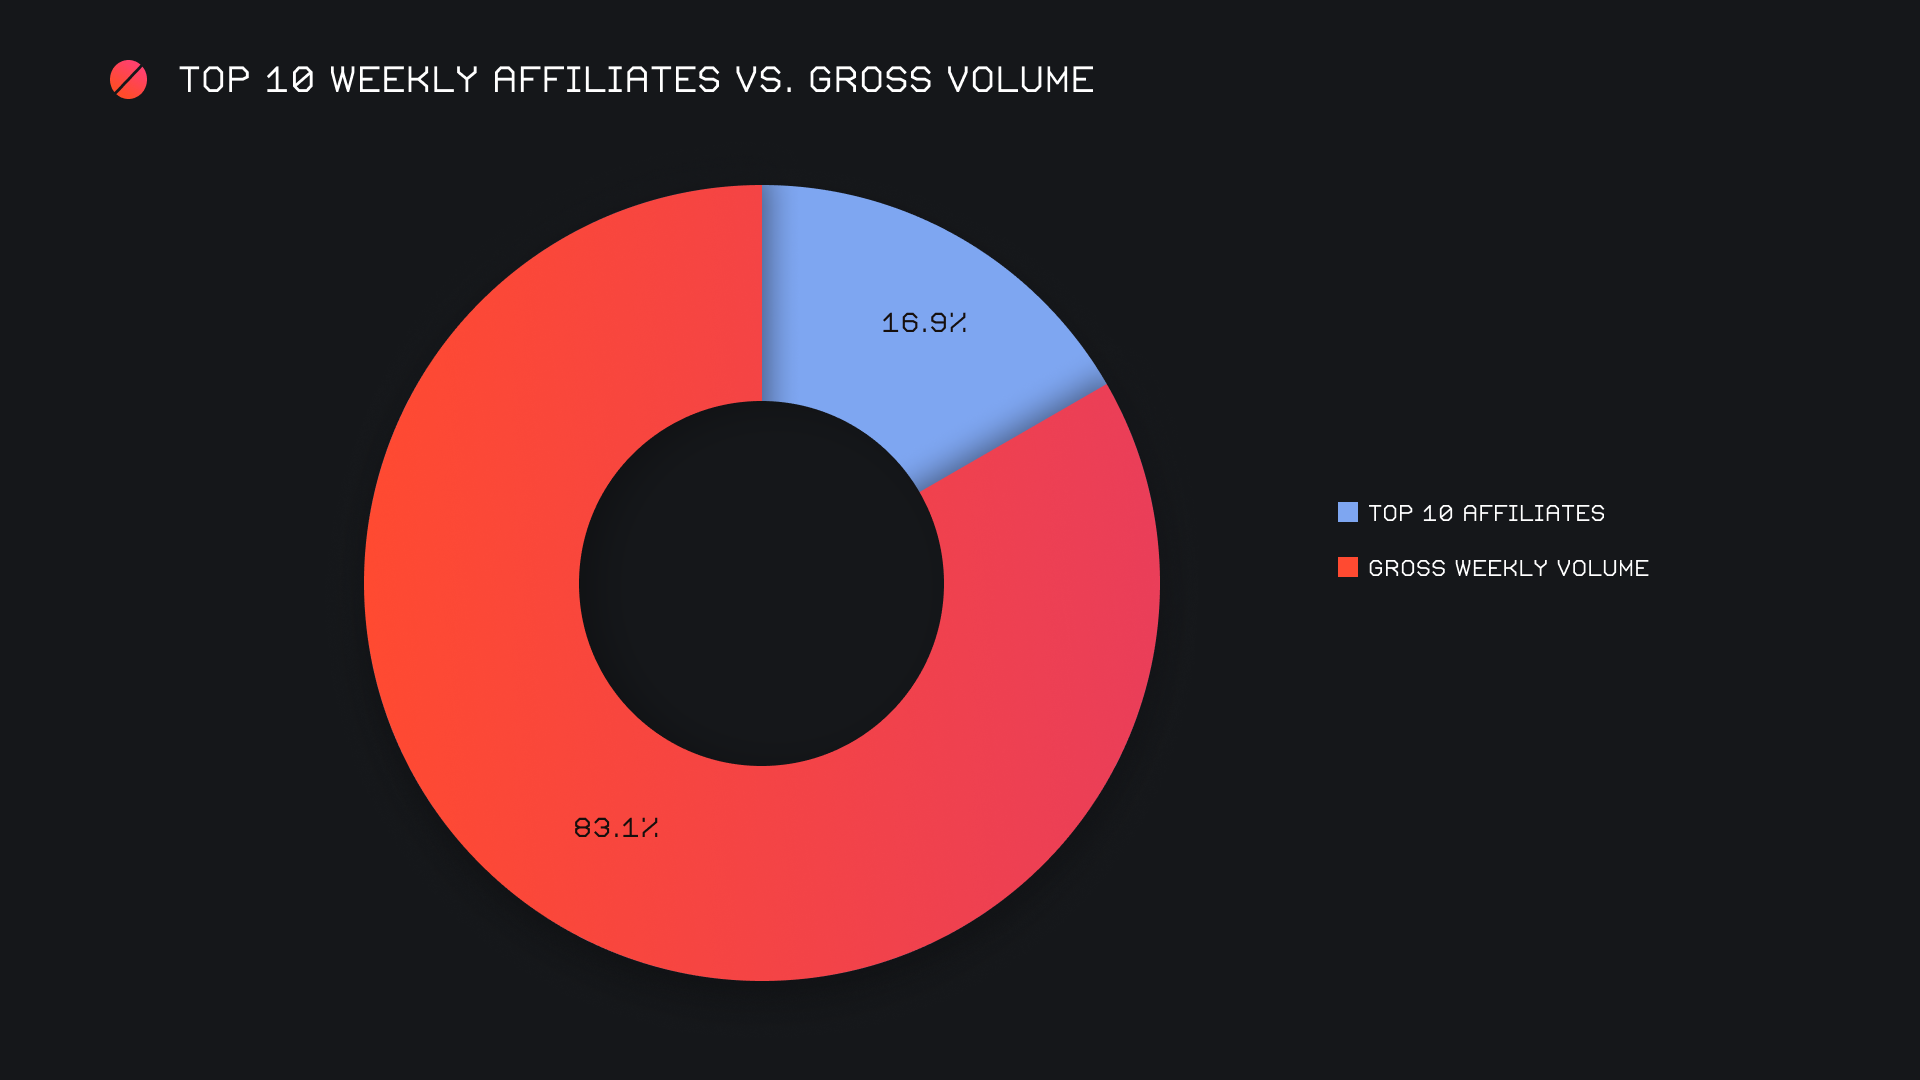
Overall, our top 10 represented 16.9% of the week’s gross volume, 1.6% lower than last week’s proportion.
That’s all for now. Thanks for reading, happy shifting and we’ll see you next time.

