SideShift.ai Weekly Report | 21st - 27th November 2023
SideShift Weekly Report: Most popular coins, XAI staking performance, and other interesting insights about SideShift.ai and the cryptocurrency space. Welcome to the eighty-second edition of the weekly stats report - your one-stop shop for all things SideShift.ai.
Welcome to the eighty-second edition of the weekly stats report - your one-stop shop for all things SideShift.ai.
This week saw SideShift token continue its upwards climb, as price bounced within the 7 day range of $0.0786 / $0.0845. At the time of writing, the price is once again sitting near the upper end of that range, at a price of $0.0841. The current market cap of XAI is $10,199,663 (+2.1%).
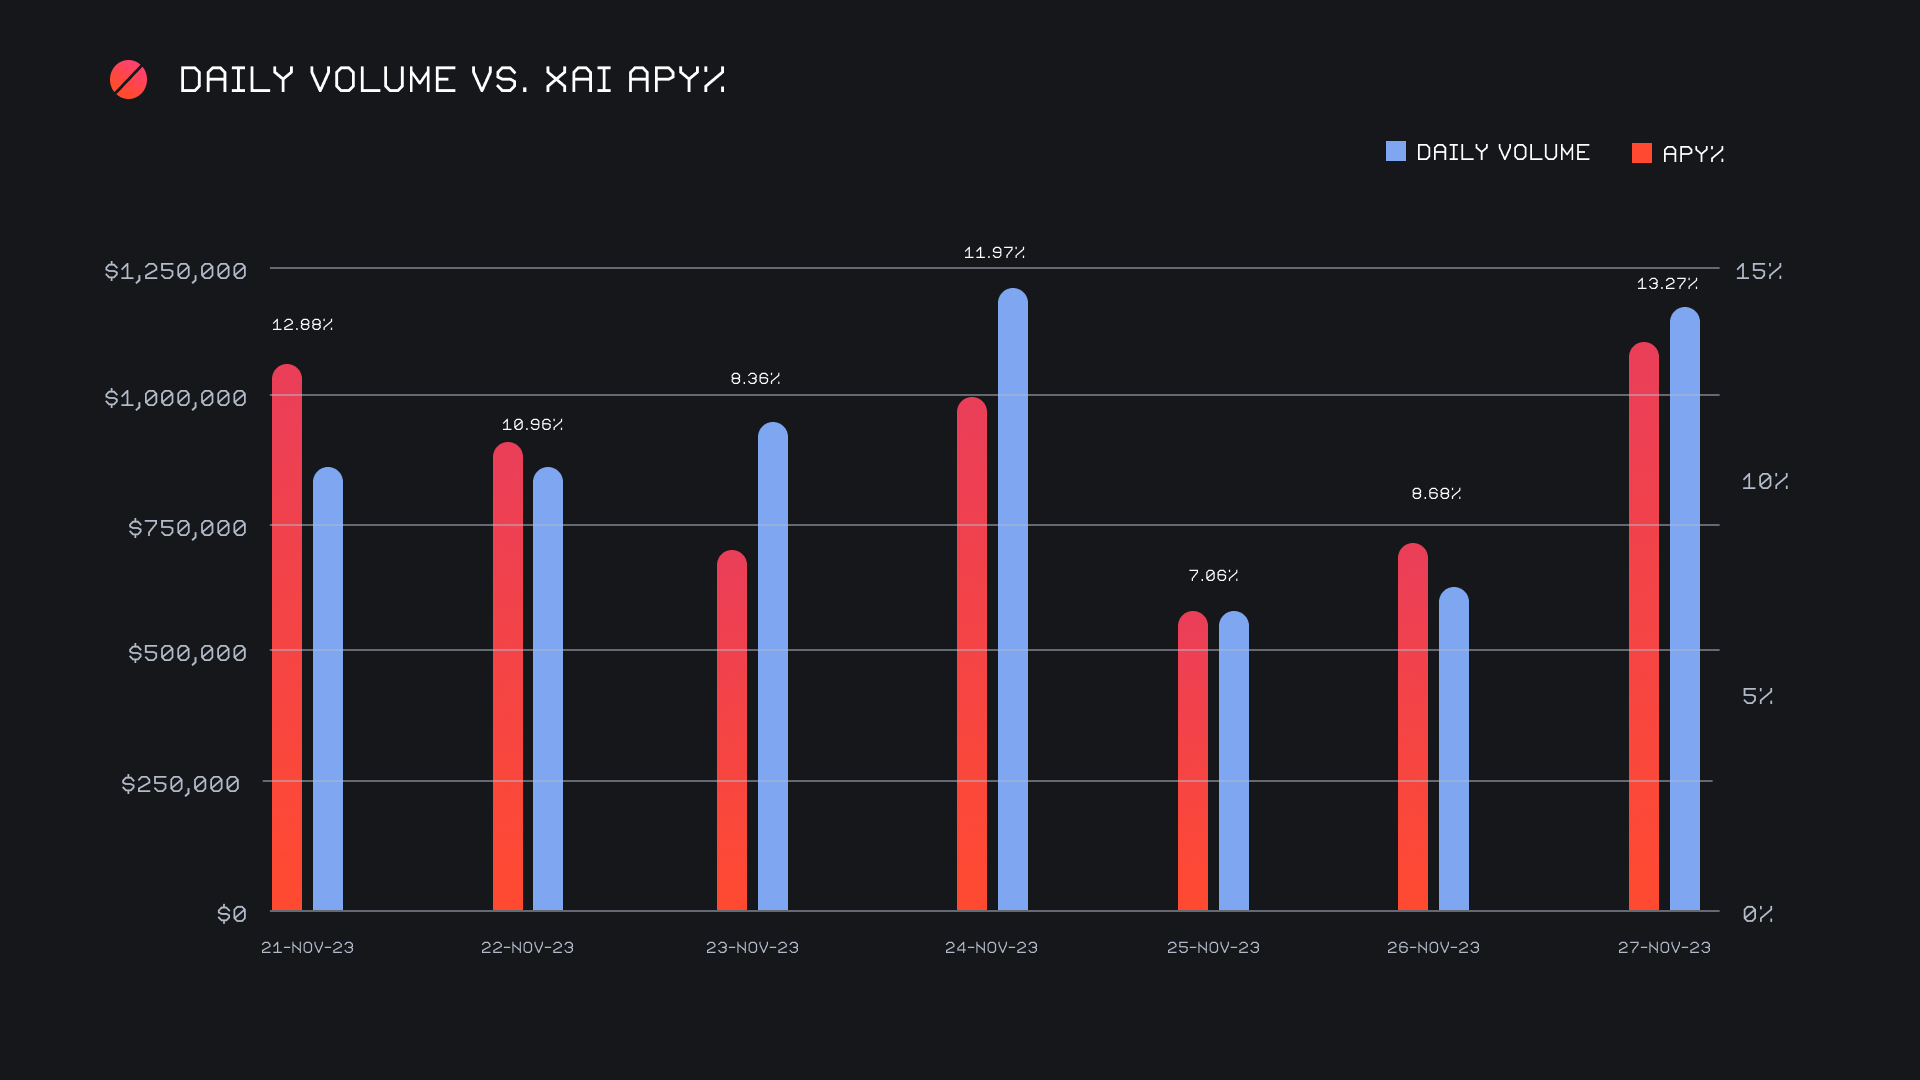
XAI stakers were rewarded with an average APY of 9.99% this week, with a daily rewards high of 38,709.41 XAI being distributed to our staking vault on November 28th, 2023. This was following a daily volume of $1.2m. This week XAI stakers received a total of 215,620.18 XAI or $17,723.98 USD in staking rewards.
An additional 50 ETH was added to SideShift’s treasury this past week, bringing the current total to a value of $6.42m. Users are encouraged to follow along directly with live treasury updates, via sideshift.ai/treasury.
Additional XAI updates:
Total Value Staked: 113,502,683 XAI (+0.2%)
Total Value Locked: $9,526,234 (+5.7%)
General Business News
The sideways market action continued this week, as the industry is still taking some time to cool off after a few weeks of frenzy. BTC made a slight push to reach a yearly high of $38k on November 24th, 2023, before settling back down near the $37k mark to end the week.
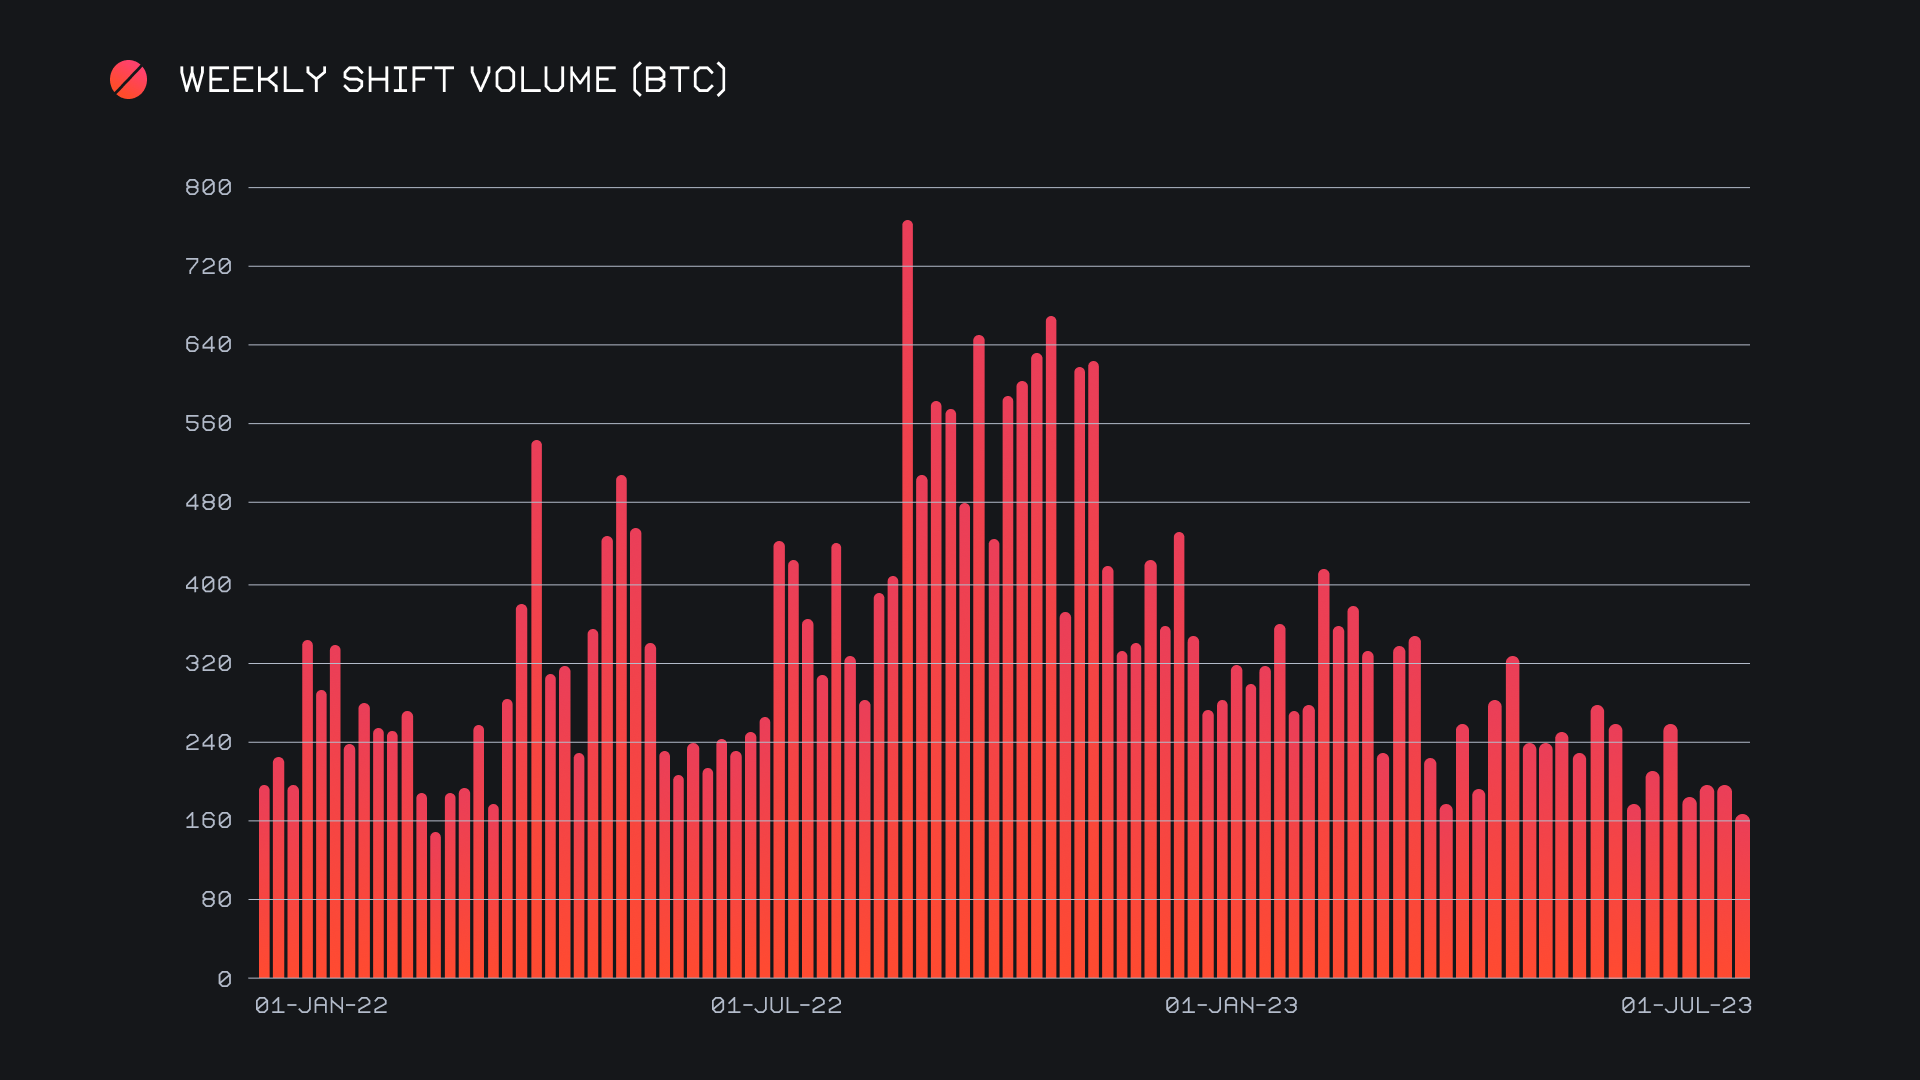
SideShift had a slower showing, noting a decline in shift volume due to the overarching sideways price action. We ended the period with a gross volume of $6.3m (-13.9%), due to less volume coming from both affiliate shifts and those carried out directly on the site. However, in spite of this decline, shift count performed stronger than ever, breaching the 7k mark and rounding off the week with a gross count of 7,031 (+14.5%). In this regard, the bulk of the increase in count can be attributed to shifts taking place directly on the site, that was shared across a breadth of networks. Together, these figures combined to produce daily averages of $899k on 1,004 shifts. When denoted in BTC, our weekly volume amounted to 168.97 BTC (-15%).
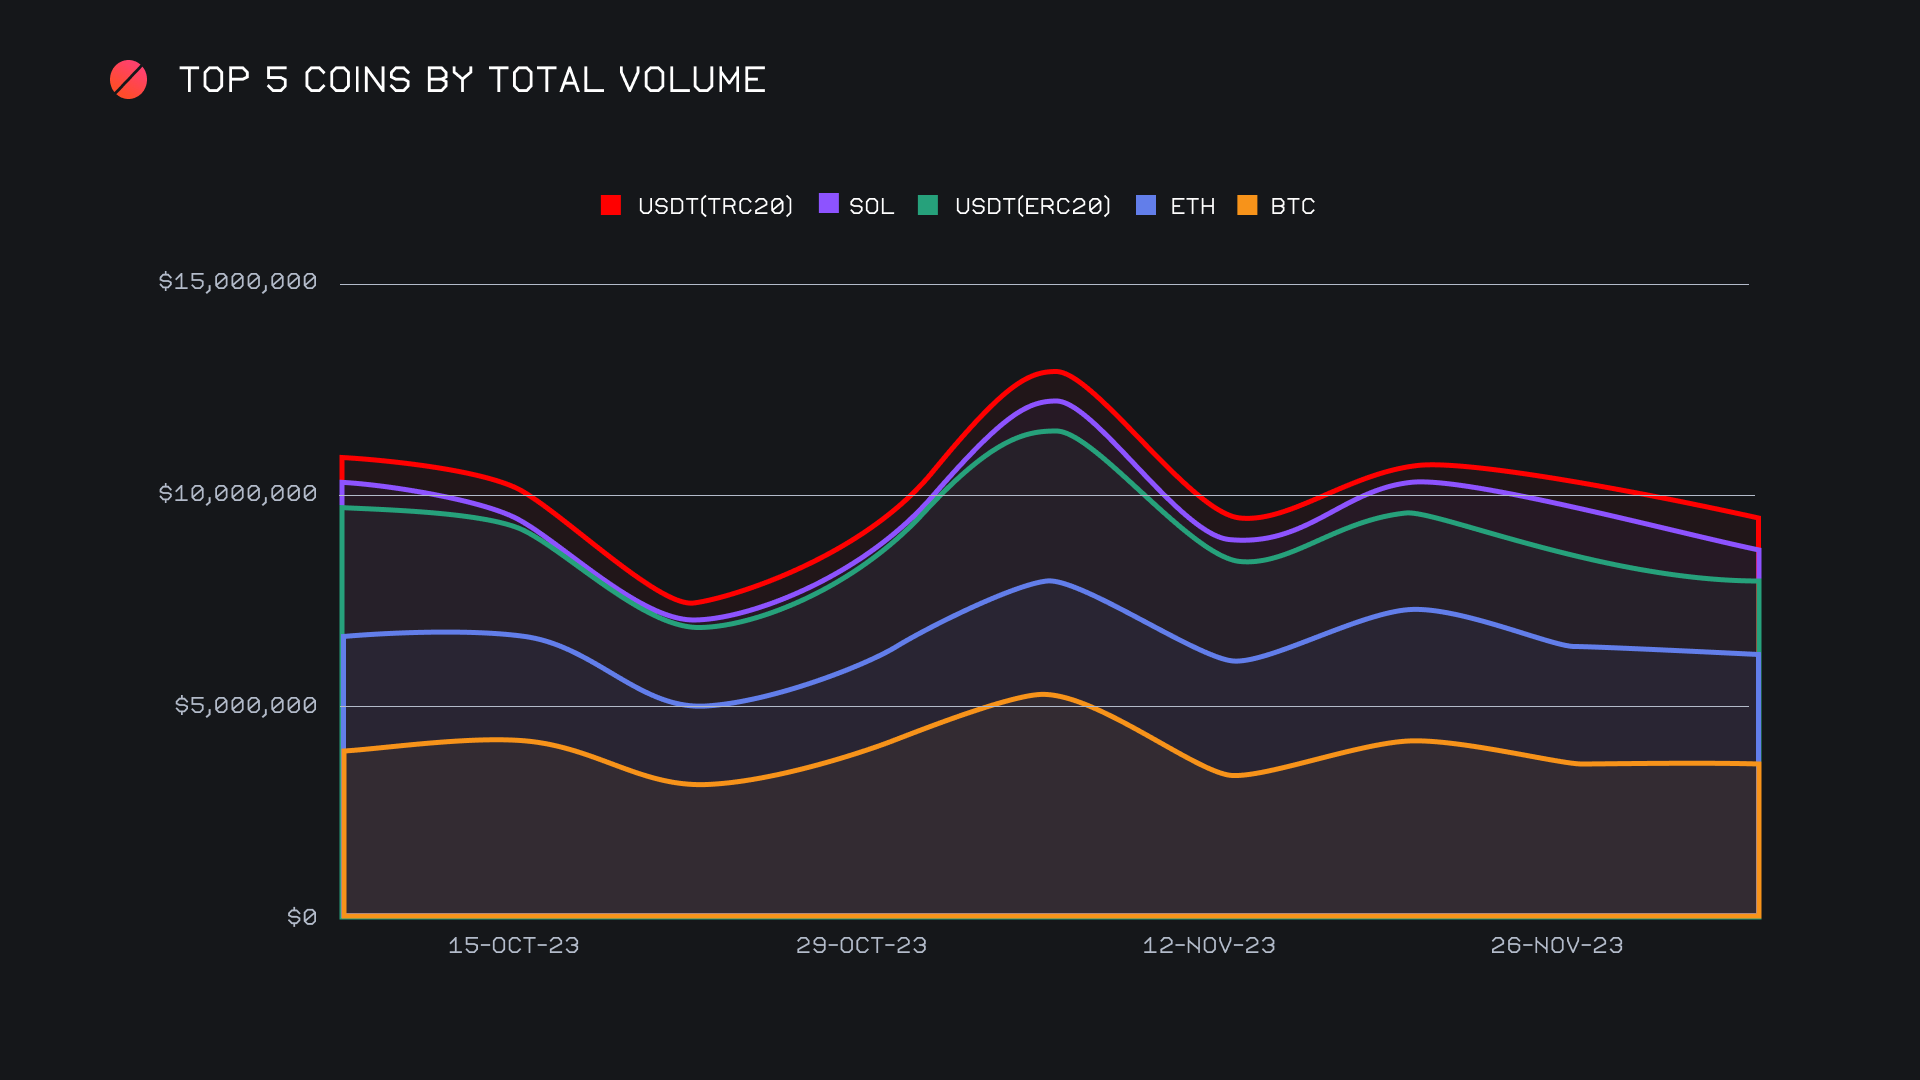
Last week’s report outlined a clear growth in the shifting of coins ranked 2-5, eating into the dominant proportion typically occupied by first placed BTC. However, this trend failed to hold up this week, and it seems the lack of market movement resulted in users flocking back to primarily BTC shifting. With a total volume (deposits + settlements) of $3.7m, BTC retained its top spot and actually noted a minor increase of +1.6%, despite the decline in shifting overall. Most notably this came from a healthy amount of user deposits, with the BTC / USDT (ERC-20) pair being at the forefront of this comeback. It regained its spot as the most popular with a weekly volume of $705k, a sign of users moving some of their gains to USDT as the market takes a breather. This managed to surpass BTC/ETH along the way, a pair that looked to be picking up some steam in recent weeks.
With that in mind, the continued user demand on SideShift for ETH is something that should be noted. When looking strictly at user settlements, ETH topped the list this week and represented the most demanded coin on SideShift, with a settlement volume of $1.1m. Interestingly, this was the only settlement coin among users to exceed $1m, higher than that of both BTC and USDT (ERC-20). Nevertheless, ETH did see less shifting overall primarily due to less user deposits, which dulled the overall sum. ETH’s total volume declined 11.5% to end in second place, with $2.6m.
The coin that was hit the hardest was SOL, which saw its total volume decline -36.3% to end with a gross $753k in weekly shifts. This decline was to be expected and came after nearly a month of solid growth, which saw the total volume of SOL blossom from ~$200k to over $1m. Using SOL and ETH as examples, we can observe how the attention of users oscillates back and forth between BTC and other top coins between periods of momentum and stagnation. As a whole, our top 5 coins remained unchanged this week but slipped below the $10m mark, ending with a combined sum of $9.3m.
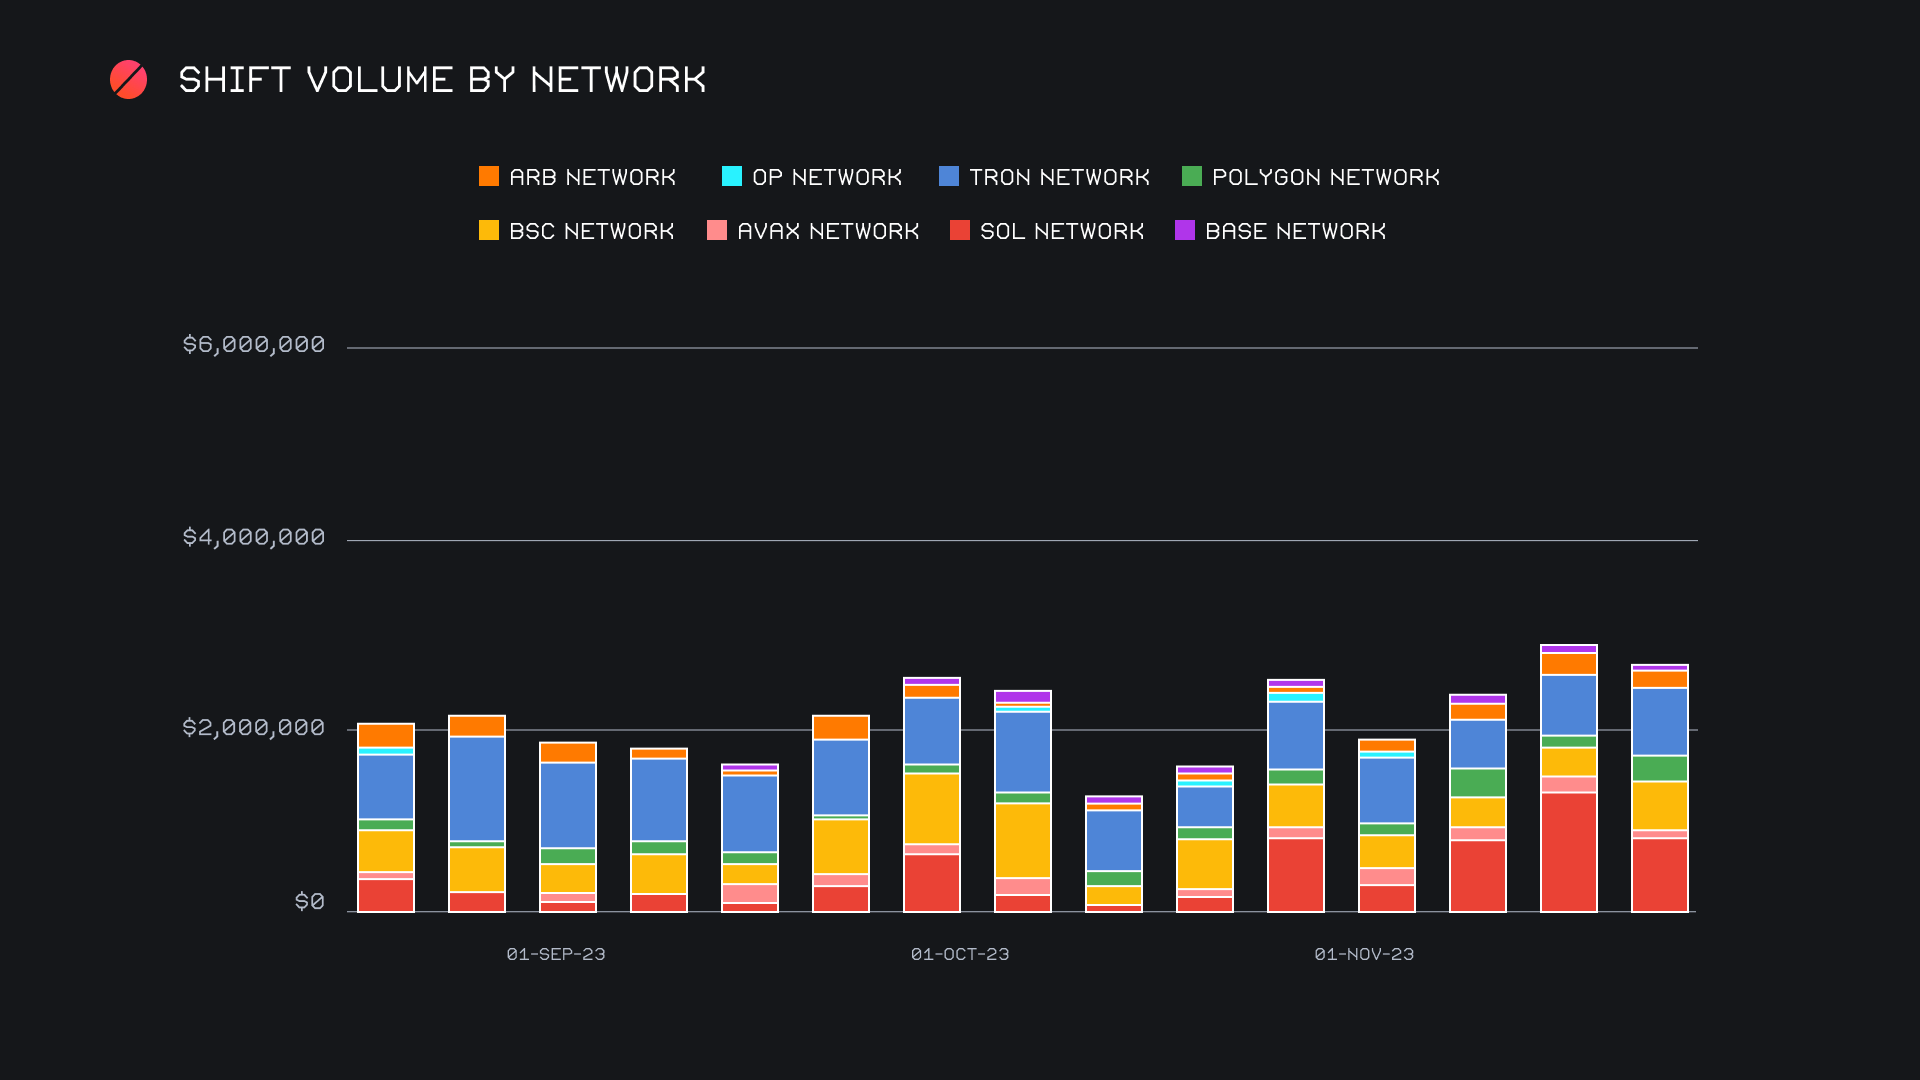
Although our weekly volume fell, a positive sign was the sustained combined volume of alternate networks to ETH. As a whole, these networks tallied $2.7m, just -7.5% lower than last week’s sum. The Solana network retained its recently newfound first place ranking, this week doing so with $868k (-35.8%). This came primarily from shifting of the native SOL token, with a slightly higher amount of settlements over deposits. User demand for SOL remained mostly steady, dipping just -8% from last week’s impressive showing. In second place was the TRON network, which rose a modest +6.3% for a gross $706k. USDT (TRC-20) no doubt led the way here, as it constantly comprises the bulk of TRON network shifting. In third place was the Binance Smart Chain (BSC) Network, jumping +69% for a total $547k. This was the result of both an increase in shifting of the native BNB token, as well as USDT (BSC).
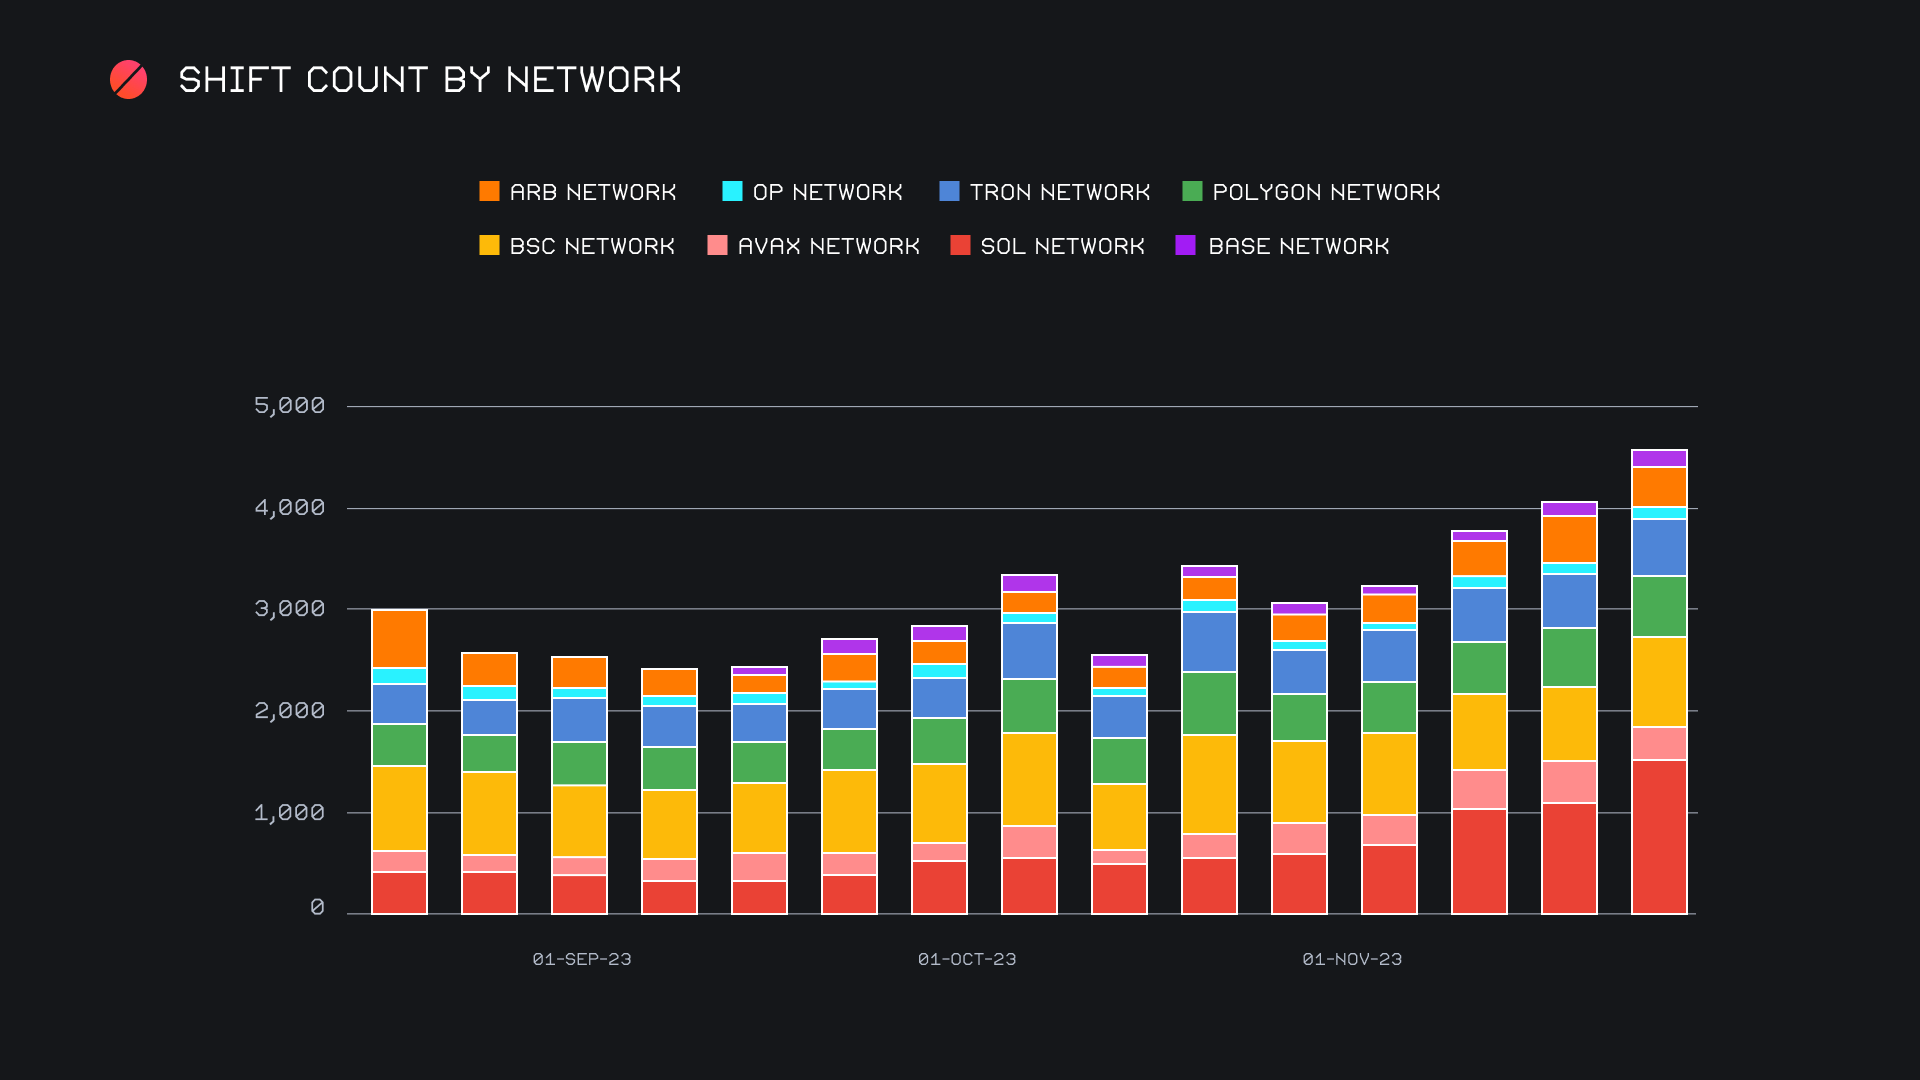
A final perspective on the positive behavior of alternate networks to ETH is evident when taking a look at shift count over the previous 4 months. Here we can note an extremely consistent uptick in gross shift count, a figure which has nearly doubled since the end of September, 2023. The momentum of the Solana network is easily visible within the chart, as this week it recorded a sizable total of 1,560 shifts. Not far behind sat the TRON network, finishing with a 4 month high shift count of 1,357. The BSC network performed well too, exceeding the upper boundary of its 4 month average, with 919 shifts. Even lower volume networks such as Polygon and Arbitrum still generated a respectable amount of shifting, with respective counts of 578 and 424. Ultimately, this growth showcases the use case and utility for SideShift, and it is a bullish sign to see users utilizing a variety of networks. With a combined count which is already nearly double that of the Ethereum network, it is possible that we continue to see the use of alternate networks trend upwards as network fee pressure on Ethereum becomes more burdensome.
Affiliate News
Our top affiliates combined for a total $1.9m this week, marking a weekly decline of -19.9%. Combined shift count decreased as well, but to a far lesser extent, falling -3.7% for a gross 1,993 shifts. The majority of our top affiliates saw shift volume slow by a decent amount, with the exception of our top placed affiliate. With $1.1m, it declined just -4% from last week, and still represented 17.3% of our total weekly volume. This occurred alongside a shift count of 1,089, accounting for a respectable 15.5% of total shifts.
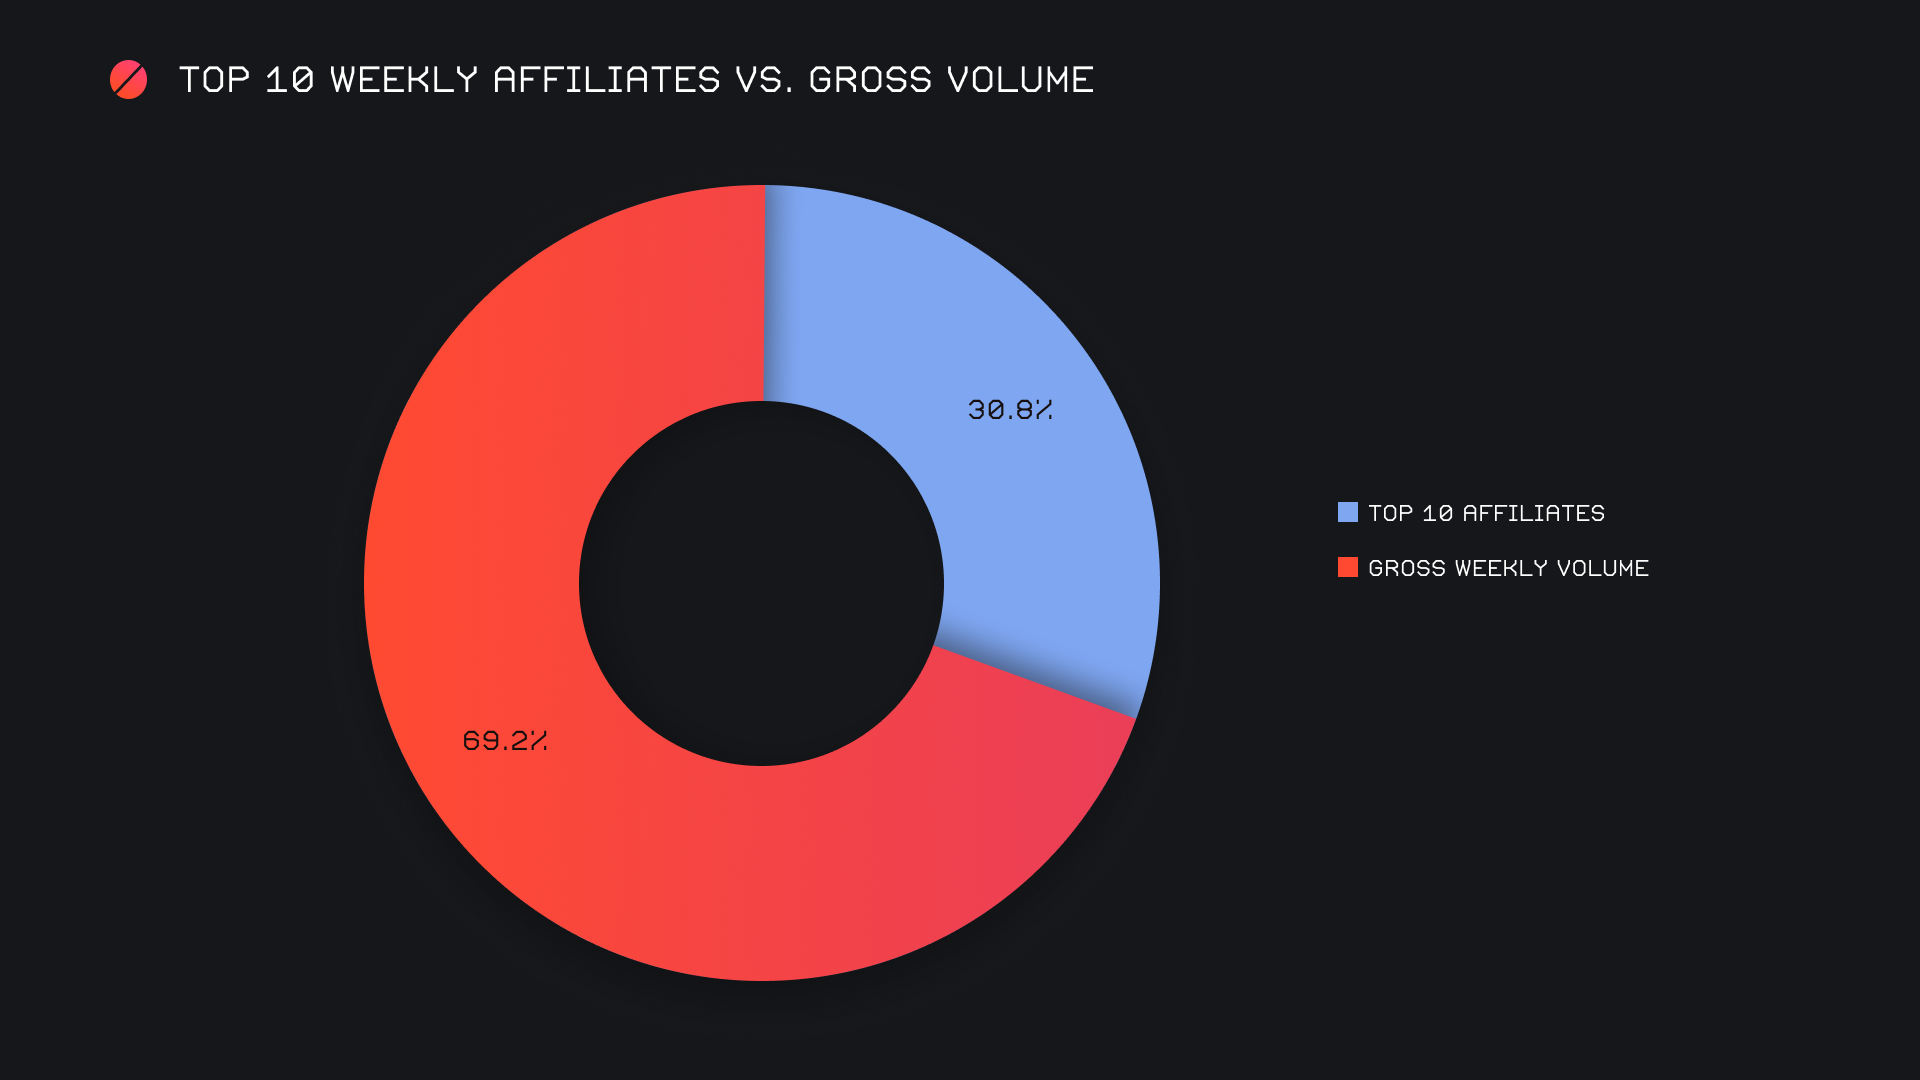
Overall, our top affiliates represented 30.8% of our weekly volume, a decrease of -2.3% from last week’s proportion.
That’s all for now. Thanks for reading, happy shifting and we’ll see you next time.

