SideShift.ai Weekly Report | 28th March - 3rd April 2023
SideShift Weekly Report: Most popular coins, XAI staking performance, and other interesting insights about SideShift.ai and the cryptocurrency space. Welcome to the forty-eighth edition of the weekly stats report - your one-stop shop for all things SideShift.ai.

Welcome to the forty-eighth edition of the weekly stats report - your one-stop shop for all things SideShift.ai.
XAI Token Market Update
This week SideShift token (XAI) moved between the 7 day range of $0.1347 / $0.1511. At the time of writing, it is sitting on the lower ends of that range, at a price of $0.1366. As denoted on our Dune Dashboard, the current circulating supply market cap of XAI is $16,576,535, which marks an 8.1% decrease from the previous week.
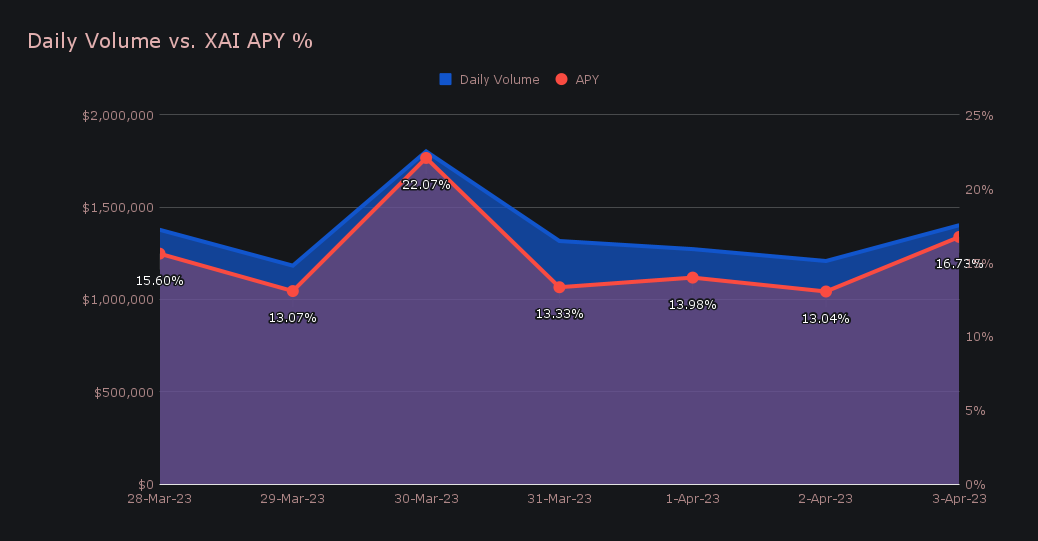
XAI stakers were rewarded with an average APY of 15.37% this week, with a daily rewards high of 49,592.67 XAI (an APY of 22.07%) being distributed directly to our staking vault on March 31st, 2023. This was following a daily volume of $1.8m. As a whole, this week XAI stakers received a total of 248,936.82, or $34,428.71 USD.
The value of 1 svXAI is now equal to 1.1755 XAI, representing a 17.55% accrual on stakers investments. A friendly reminder that the easiest way to stake XAI is to shift directly to svXAI from any coin of your choice.
An additional 100 ETH was deposited to the treasury over the course of the week. At the time of writing, the treasury balance is sitting at $3.96m. Users can follow along with live treasury updates directly on zapper.fi.
Additional XAI updates:
Total Value Staked: 91,021,794 XAI
Total Value Locked: $12,604,698
General Business News:
Although a fairly regular week with nothing out of the norm, this week represented a significant moment in SideShift’s history. We surpassed the $900m mark in all time volume, inching ever closer to the major, once far off milestone of $1b. Of this volume, $100m has been achieved already thus far in 2023.
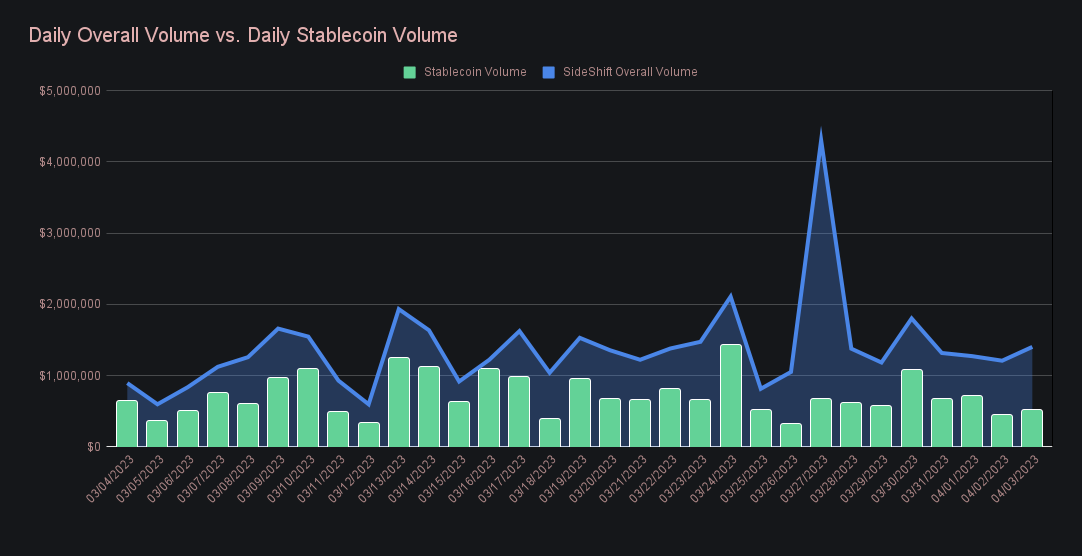
SideShift rounded off the period with a gross weekly volume of $9.6m, a 22% dip from the strong performance recorded last week. Although user volume was down, a big contributor to the change in volume was a lower overall amount of liquidity shifts, which fell 43% from last week’s hefty sum of $3.7m. Despite this decrease, our shift count reached near record setting levels once again and maintained its 8,000 per week benchmark, with a sum of 8,059. These figures combined to produce daily gross averages of $1.4m on 1,151 shifts.
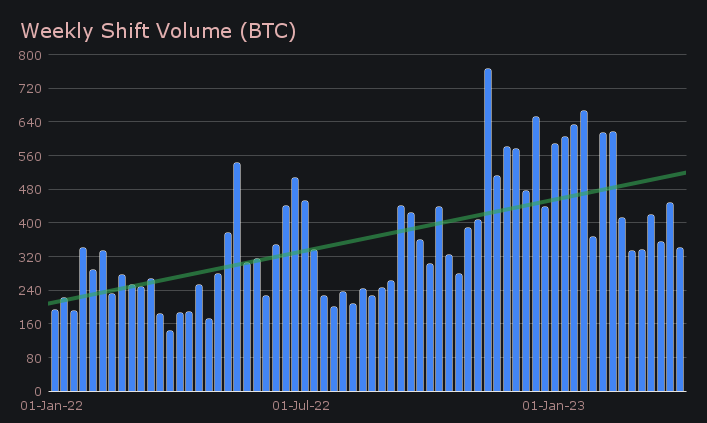
When looking at weekly volume denoted in BTC, the equivalent change is pretty much on par with that of USD, as it decreased 23.9% to total 340.64 BTC.
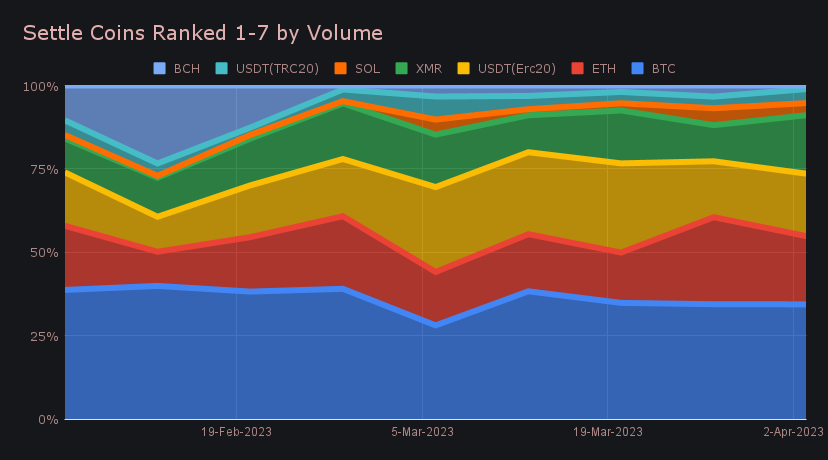
While BTC still remains our most popular coin and made up 26% of our total volume, we did see a plunge in its overall volume. It fell by 32% from last week’s $7.2m to net just $4.9m this week. This was more notable on the deposit side, where we received $1.3m less BTC compared to the previous week (-37.1%), while BTC settlements fluctuated by a lesser amount, and decreased by $970k (-27.1%).
Ethereum took an even bigger hit, with an overall volume of $3.2m being a substantial 41% lower than last week. This again was felt for both deposits ($1.7m) and settlements ($1.5m), which had respective fall-offs of -38.5% and -42.8%. However, an interesting point about ETH is that despite the drop in overall volume, it proved to be the only top coin to show an increase in user demand. ETH settlements strictly from users actually rose 31.5% and totalled $1.3m, while all other top 5 coins saw double digit decreases in the same metric.
The standout among our popular coins was in fact XMR. It saw an increase of more than 25% in overall volume, and brought in $2.7m. It was predominantly deposits which led the way, as they increased 34.1% for a net of $1.4m. However, settlements also had a respectable performance, rising 18.2% for a sum of $1.3m, which helped achieve a healthy balance in volume. You can observe the relative stability of BTC, along with the dip in ETH, and the rise in XMR demand in the below chart.
A major reason for this XMR deposit volume was the popularity of the XMR/BTC pair, as it represented 6.4% of weekly shift volume with a net of $614k. Still, this failed to outdo BTC/USDT (ERC-20), which continues its reign among popular user shift pairs. For nearly 3 consecutive months it has led all shift pairs, this week doing so with a total of $874k (9.2% of our weekly volume).
Overall stablecoin volume had a small drop this week, reducing by 5.6% to bring in just over $4.9m in total volume (deposits + settlements). The biggest impact here was the result of our most popular stablecoin, USDT on the Ethereum network, which decreased by more than 18% to net $2.8m. That being said, all other stablecoins combined actually increased by 20% in overall volume, and produced $2.1m. USDC on Ethereum led this pack with $862k (+48.8%), which was a healthy split between deposits and settlements. DAI also reached 6 figures with $102k in overall volume (+160.7%), while USDT on Binance Smart Chain exploded to $230k (244.6%), mostly due to an influx in deposits. USDT on Ethereum represented 57.4% of total stablecoin volume this week, which is less dominant compared to last week’s proportion of 66.5%.
When looking at the performance of various chains we can see that most had a rough week when compared to the last, but show some good indicators upon a deeper analysis. The Ethereum network, which is by far the most popular, saw volume drop 13.5% for a total of $8.3m. However, this actually represented 45% of our volume involving a coin pair on the Ethereum network, which is an increase from last week’s proportion of 40%. This shows that while seeing a decrease in dollar terms, the Ethereum network has been more resilient compared to other networks this week.
Meanwhile, the battle for second place among alternate chains still rages on. The SOL network saw a 46.5% decrease to $616k from its outstanding performance last week, while TRON clawed back into second place with $703k (-21.8%). Binance Smart Chain, once firmly the most popular besides the Ethereum network, had a tough go, and only produced $215k in volume (-46.8%). This possibly came as a result of negative news stemming from Binance. It was in fact the Polygon network which was the only chain to see a green week, as a 87.7% jump leapfrogged BSC and produced a volume of $382k. A final notable mention is the ongoing strength of Arbitrum - this week it beat out Polygon for third place with a relatively strong volume of $384k (-11.3%).
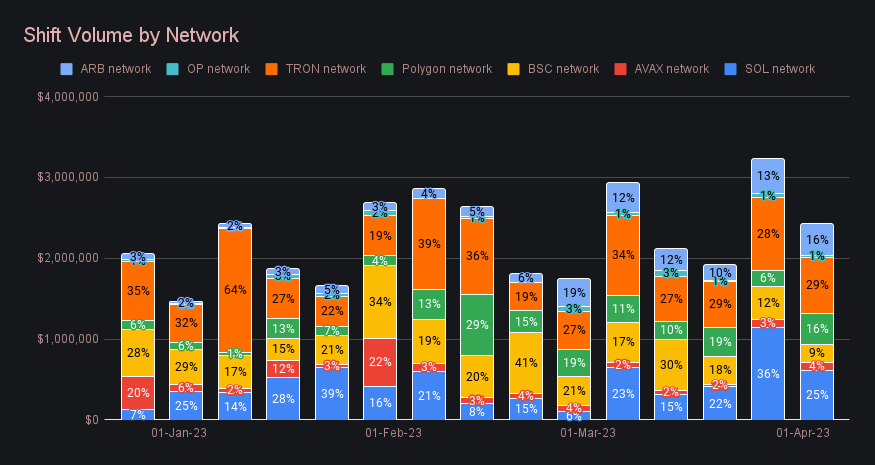
Generally speaking, we had a smooth week with only some minor inconveniences. As we work to upgrade our LN capabilities, certain lightning payments have not been successful. Our team is aware of this and actively working to improve its reliability. Further, we had a brief period of instability with Polygon shifts this week, resulting in temporary shift delays. It was resolved within a few hours and all stuck shifts were processed as normal.
Affiliate News
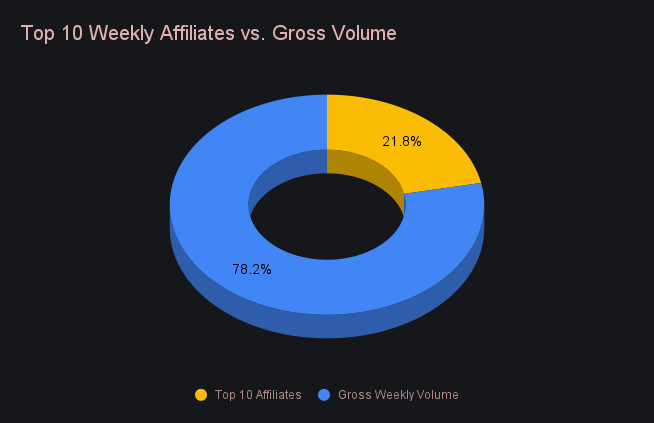
Our top 10 affiliates combined for a healthy sum of $2.1m, although 12.1% lower than last week’s total. Net shift count decreased by a lesser amount, down just 2.3% for a total of 2,165 shifts. Of this, our top affiliate’s volume grew slightly and represented 11.8% of the weekly total, along with 14.6% of total shifts. All together, the top affiliates represented 21.8% of weekly volume, up 2.6% from the last report.
That’s all for now. Thanks for reading, happy shifting and we’ll see you next time.

