SideShift.ai Weekly Report | 6th - 12th June 2023
SideShift Weekly Report: Most popular coins, XAI staking performance, and other interesting insights about SideShift.ai and the cryptocurrency space. Welcome to the fifty-eighth edition of the weekly stats report - your one-stop shop for all things SideShift.ai.
Welcome to the fifty-eighth edition of the weekly stats report - your one-stop shop for all things SideShift.ai.
XAI Token Market Update
This week SideShift token (XAI) moved within the 7 day range of $0.1184 / $0.1293. XAI has continued its gradual climb over the course of the week and at the time of writing is sitting near the top of that range, with a price of $0.1280. The current market cap of XAI is $15,135,692 (+4.6%), as denoted on our Dune Dashboard.
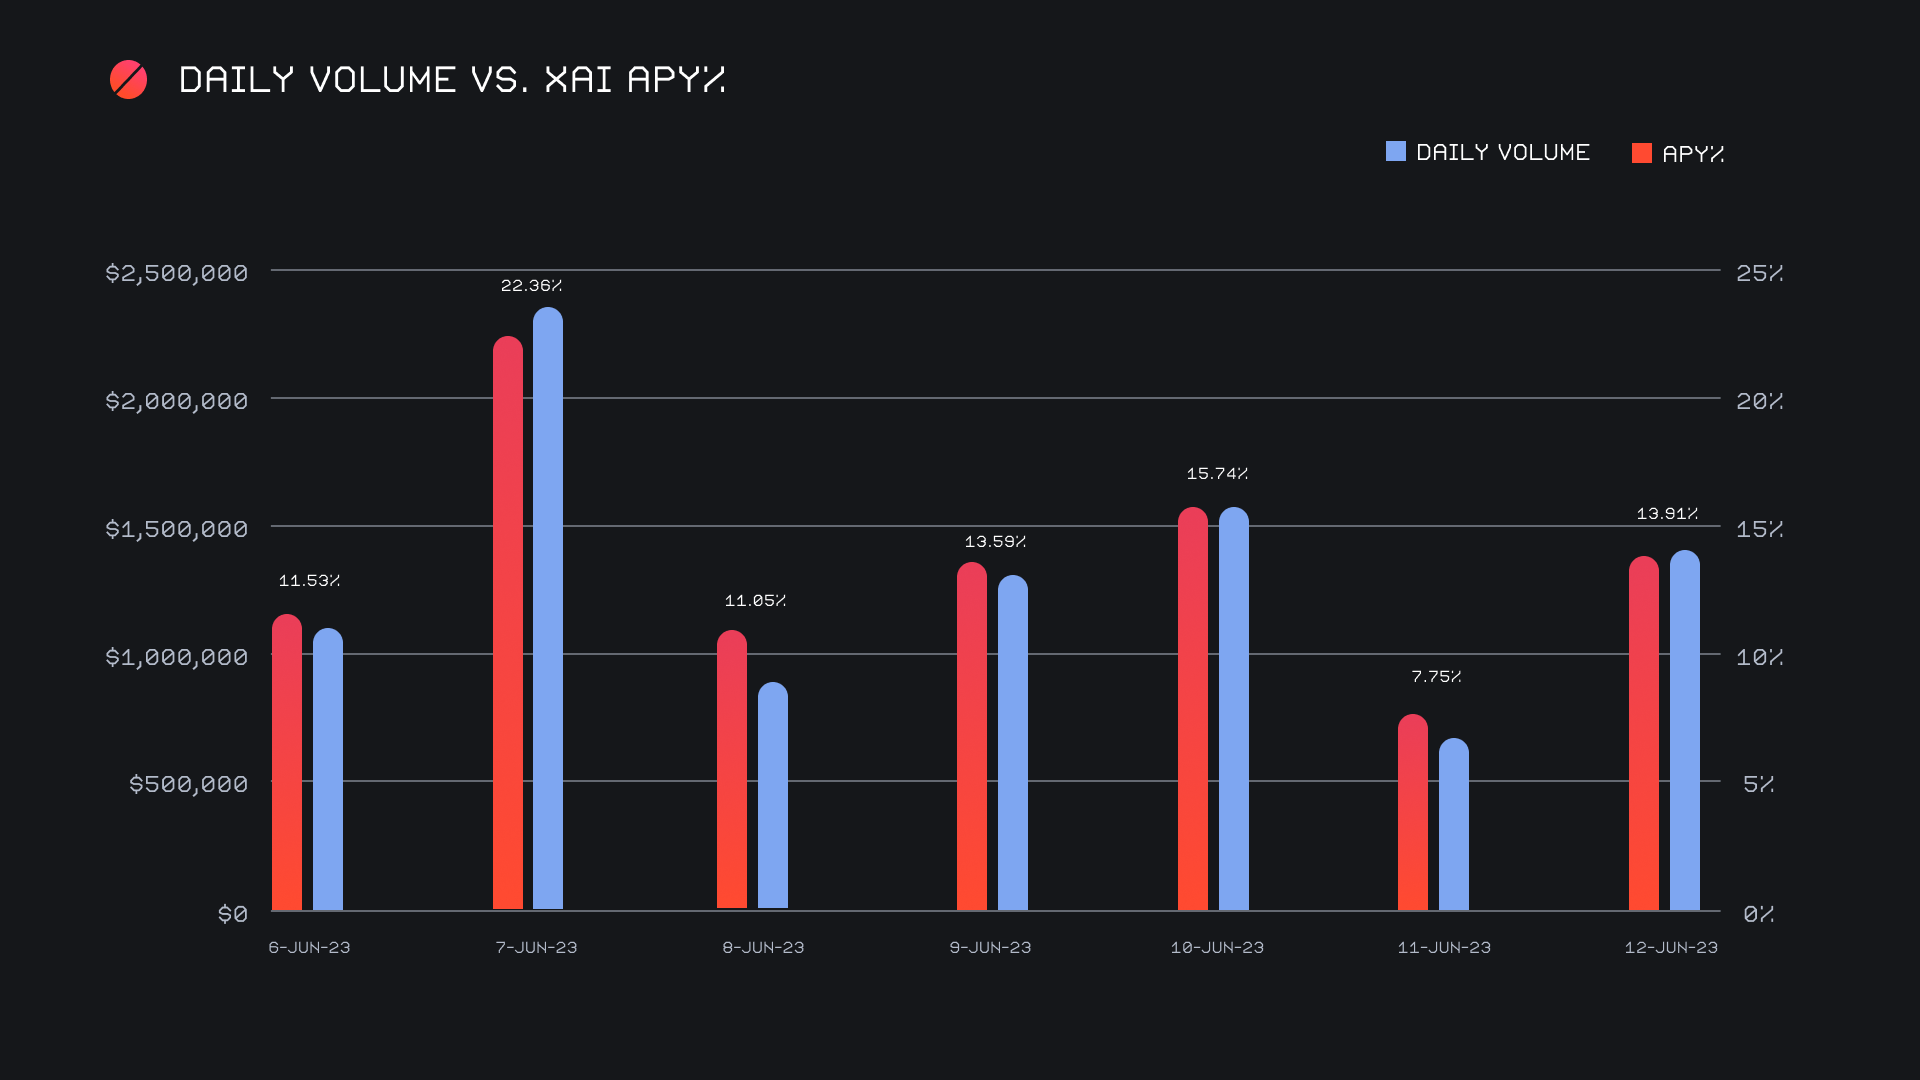
XAI stakers were rewarded with an average APY of 14.07% this week, with a daily rewards high of 56,994.55 XAI (an APY of 22.36%) being distributed to our staking vault on June 8th, 2023. This was following a daily volume of $2.4m. This week XAI stakers received a total of 252,728.99 XAI, or $31,544.36 USD in staking rewards.
The price of 1 svXAI is now equal to 1.2011 XAI, representing a 20.11% accrual on stakers’ investments. A friendly reminder that the easiest way to participate in XAI staking is to shift directly to svXAI from any coin of your choice.
Additional XAI updates:
Total Value Staked: 104,388,093 XAI (+2.3%)
Total Value Locked: $12,832,428 (+6.8%)
General Business News:
The SEC crackdown continued this week, with many altcoins bleeding hard. BTC has managed to more or less hold its ground, falling only a few percent over the course of the 7 days.
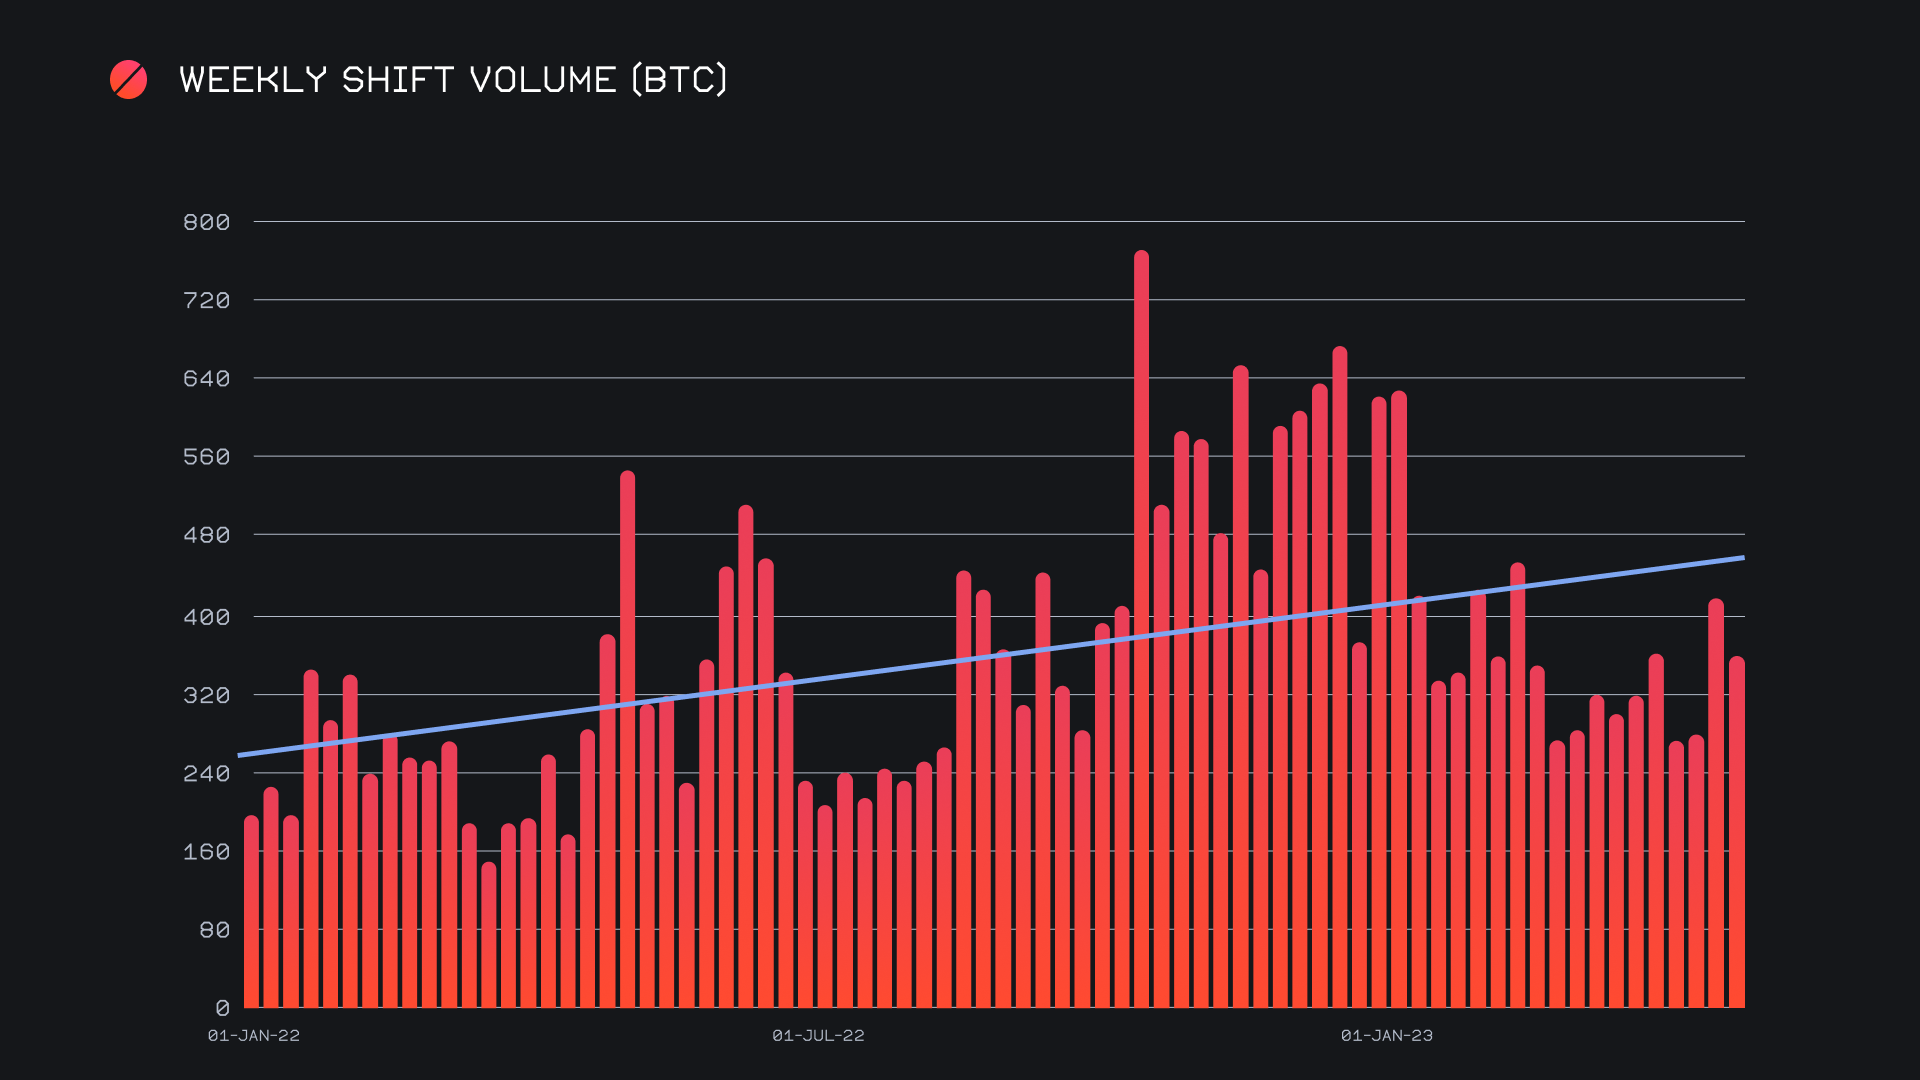
SideShift had a solid week, riding the tailwinds of a stellar performance in the week prior. We ended the period with a gross volume of $9.3m (-16.5%) alongside a shift count of 7,121 (-8.6%), which are healthy numbers despite the percentage decreases. Together, these figures combined to produce daily averages of $1.3m on 1,017 shifts. Whereas last week a vast majority of shifts occurred directly on the site, this week saw a higher portion of shifts via integrations, with several of our top integrators experiencing a positive week on week change in volume greater than 40%. When denoted in BTC, this week's volume totalled 353.65 BTC (-14.2%).
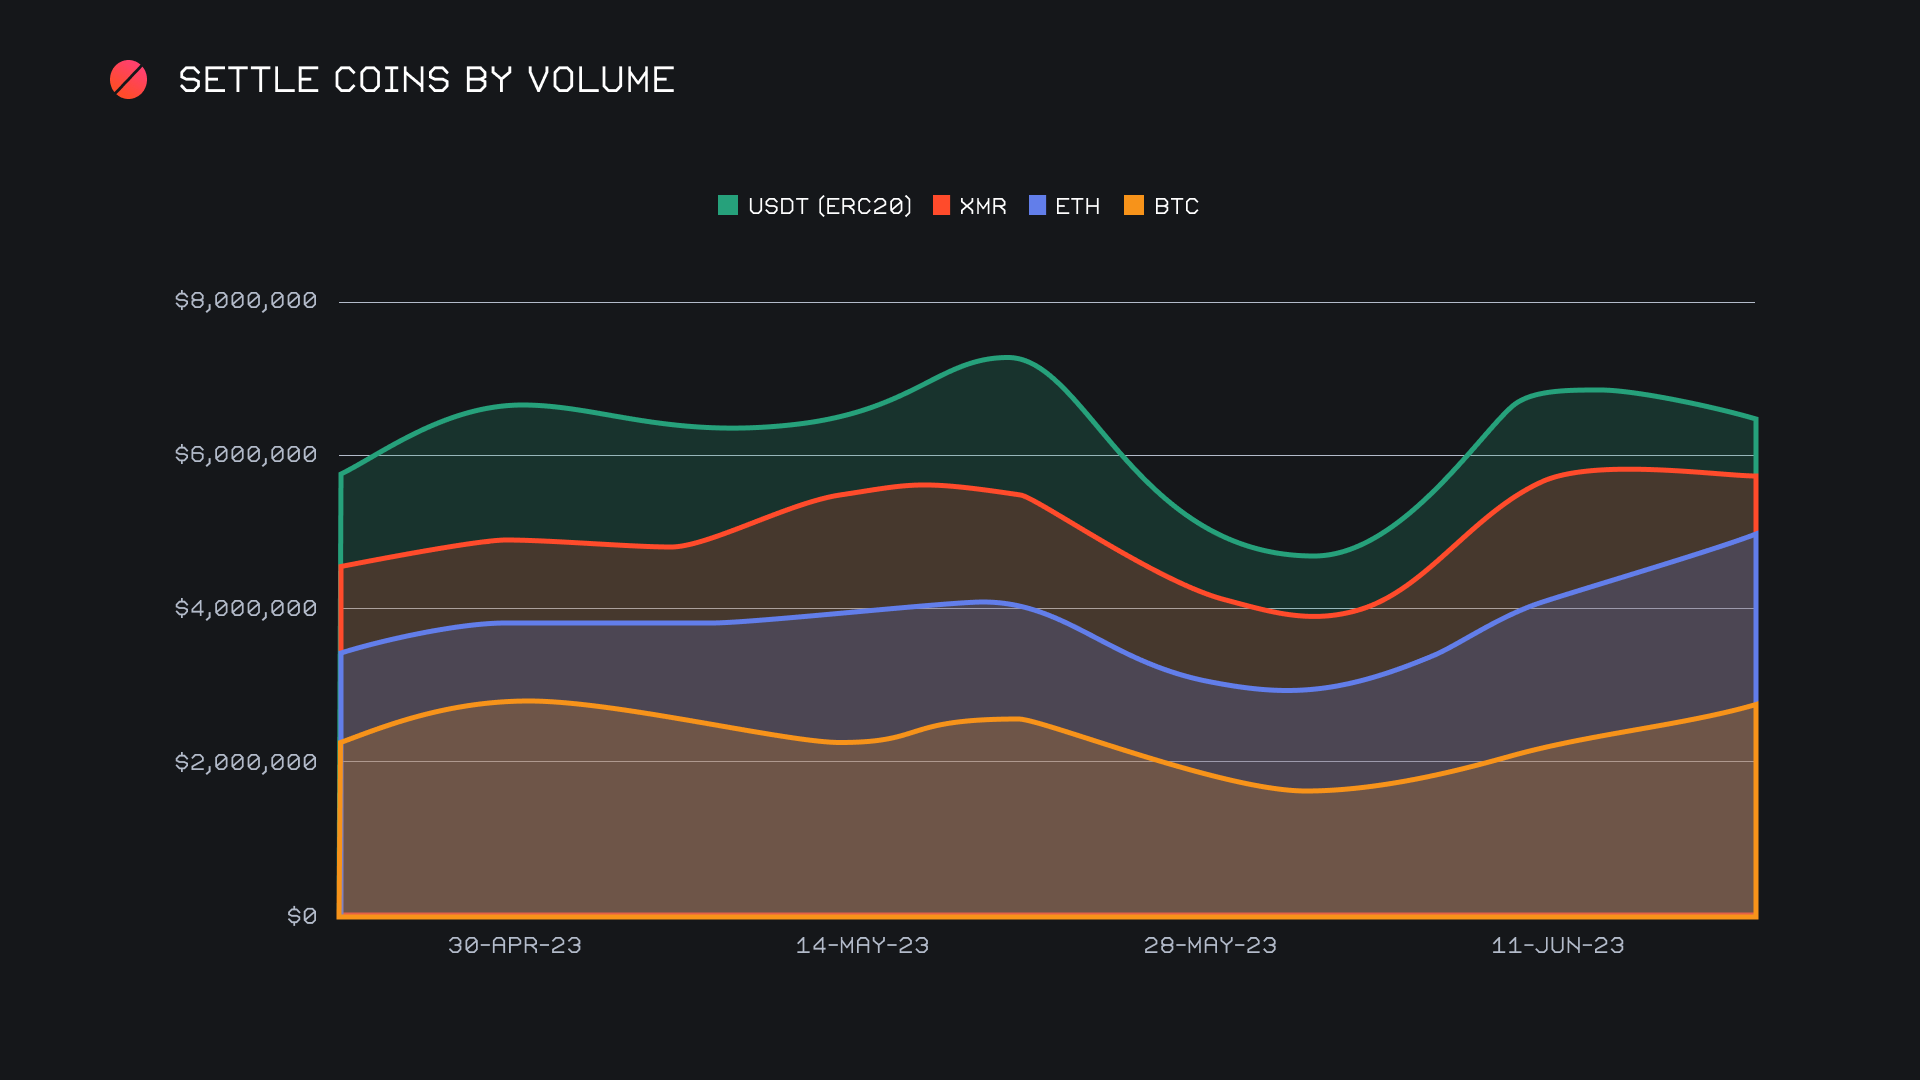
In the previous report, it was outlined that we experienced a rush of activity on alternate networks. Collectively, these alternate networks besides Ethereum managed to pierce the $6m mark with ease, setting a clear all time high for this metric. This week however, it seems the majority of shift volume has rotated back into the familiar top coins of BTC and ETH. As it typically does, BTC finished first when measuring total volume (deposits + settlements), rising 18.6% to end the period with $5.2m. Aside from 8th placed XRP (which had a comparatively low $452k in total volume), BTC saw the highest positive percentage change among top coins. ETH followed a similar pattern but with less of a change, rising 9.9% for a gross $4.2m, enough to secure second place.
In the case of BTC, a key reason for the volume change was an increased demand in settlements from users. With a total of $2.4m, these user settlements were nearly $1.1m higher than the next popular option, ETH. This is an indication that users were inclined to scoop up some cheaper BTC, or perhaps escape the extremely volatile altcoin market for the time being.
ETH on the other hand had a healthy increase in user deposits, rising 33.9% for a total $1.7m. ETH deposits were only just short of first placed BTC, which sat ~$80k higher. At the same time, ETH settlements decreased by 21.9% to total $1.3m, which resulted in ETH’s total volume (deposits + settlements) growing at a rate slower than BTC. The increase in ETH deposits from users as compared to settlements resulted in a surplus of ETH, and therefore resulted in a rise of ETH liquidity trades. As a whole, these points are the reasons that gross BTC and ETH settle volume grew to account for a larger proportion of the total. This is notable in the chart below.
As previously mentioned, alternate networks to ETH saw a sharp decline in the wake of a record setting week. Last week, these networks collectively passed the ETH network for the very first time. This week they fell 53.4% from those highs and combined for $3.1m, less than half the total sum of ETH, which finished with $6.8m. The Binance Smart Chain (BSC) network still prevailed as the most popular with $968k, despite a hefty decline of 63.7%. In second place was the Tron network, which dropped 39.1% for a net $659k, followed by the ARB network, which had the biggest percentage change of all, declining 64.6% for a total volume of $618k. The only two networks to see week on week growth were the AVAX network with $188k (+103.8%), and to a much lesser extent, the OP network with $19k (+28.8%). Although the percentage changes are extremely red, you can observe that the volume recorded this week was largely on par with that generated in previous months.
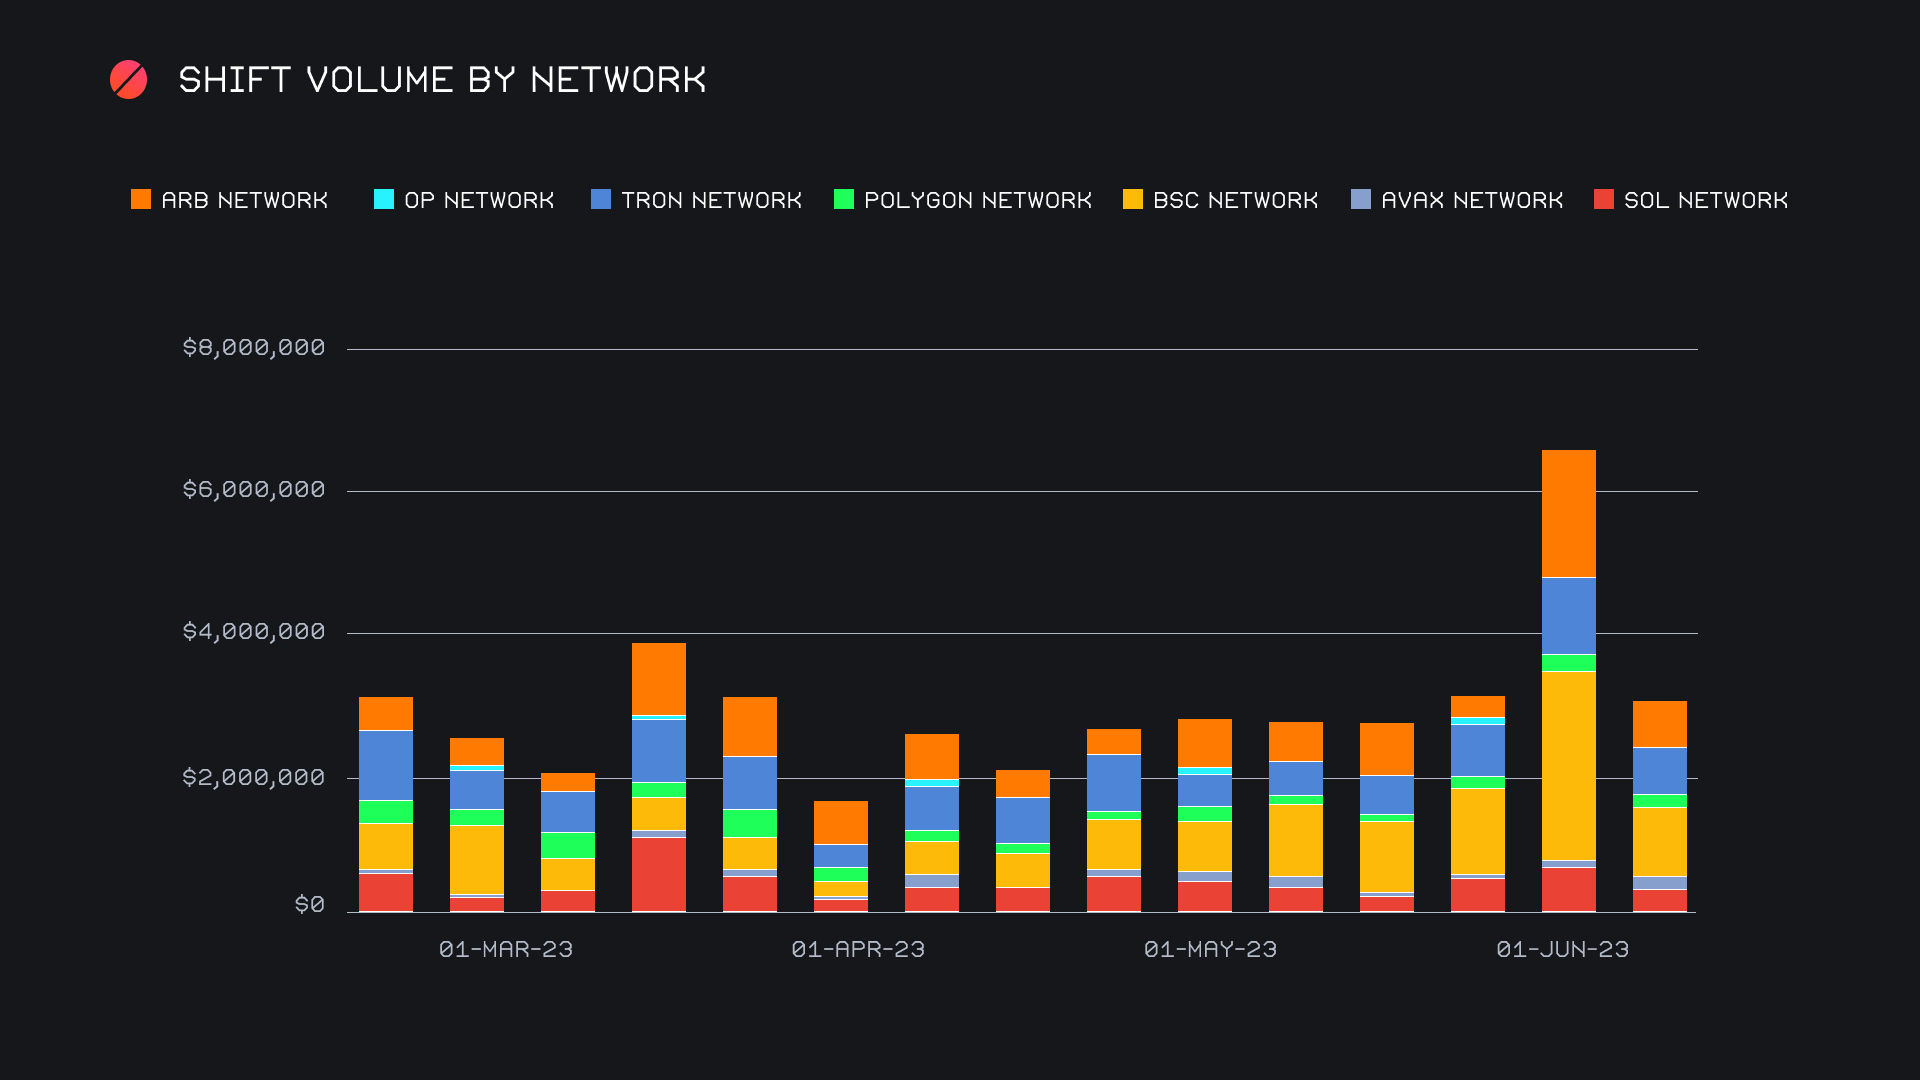
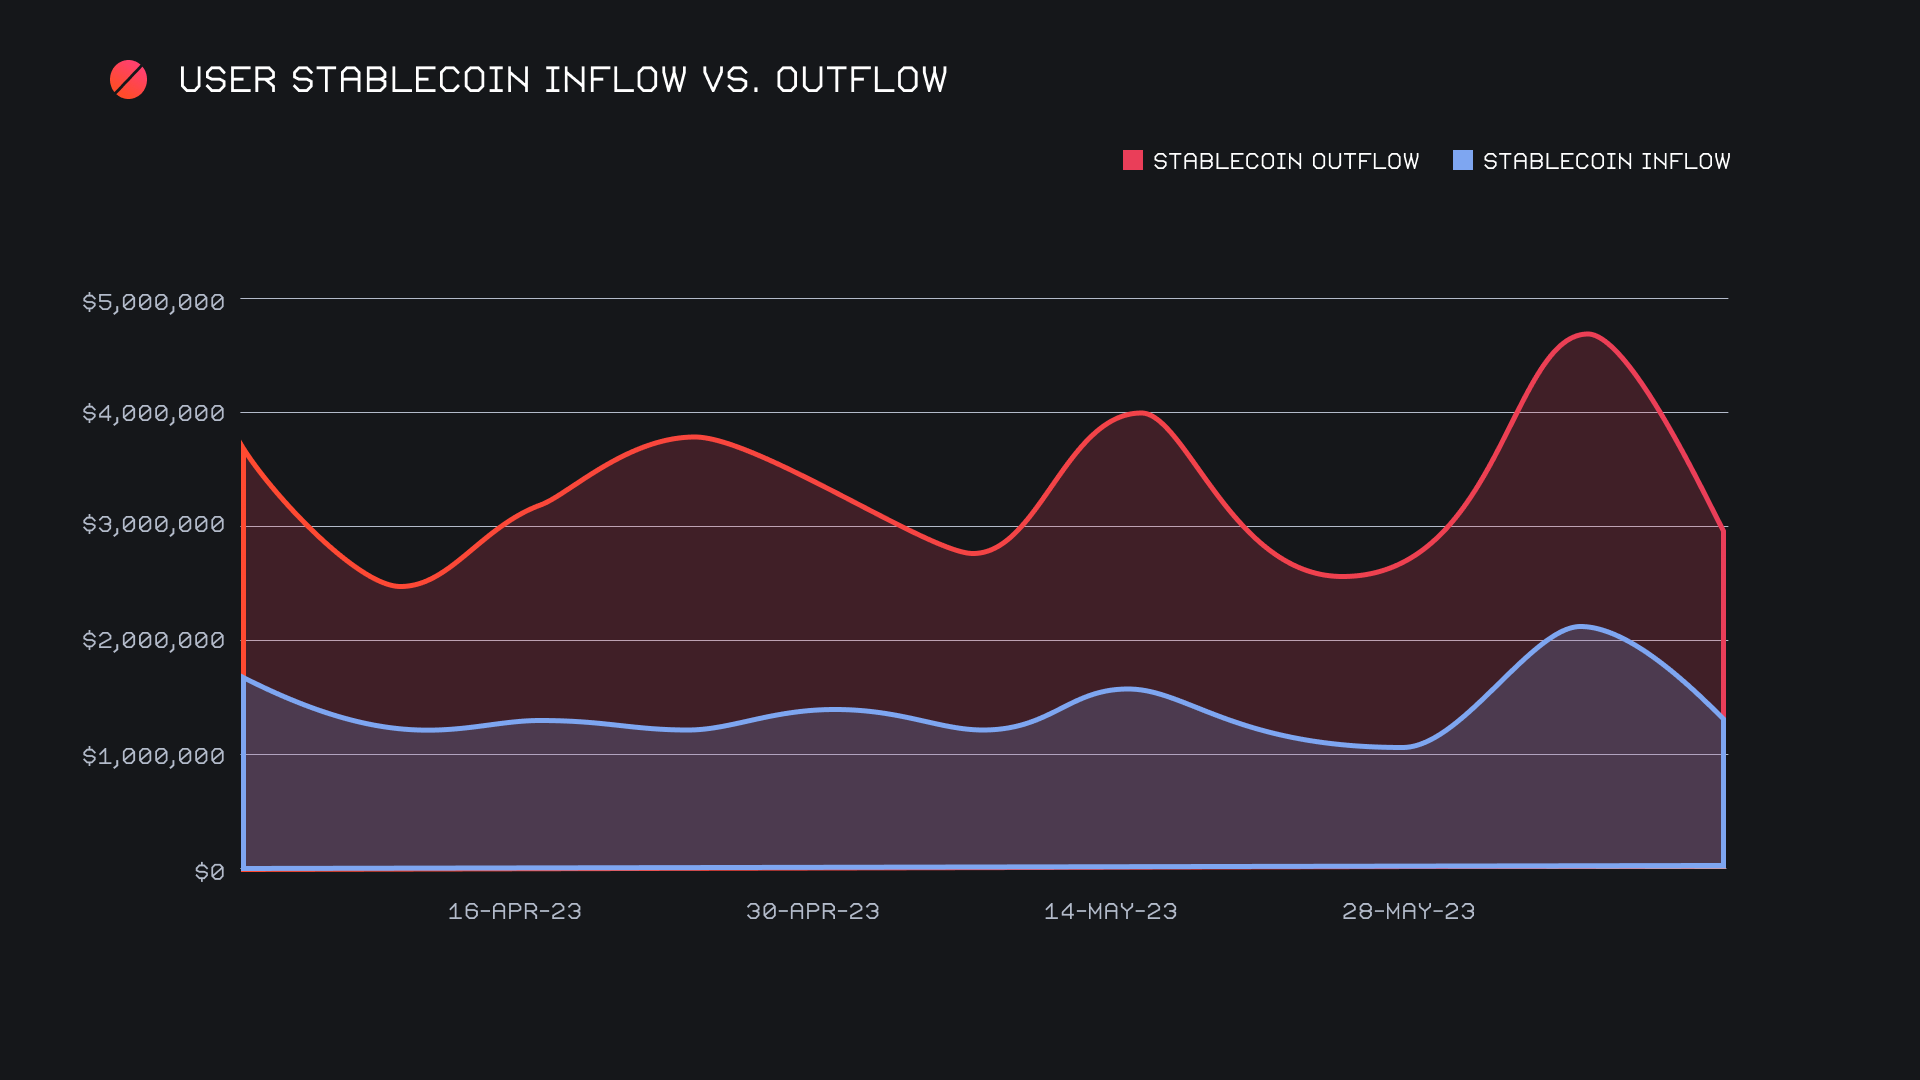
A primary reason for the surge experienced last week was the unusual rush of stablecoin shifting on alternate networks. It appears that much of that wave was an anomaly, as these numbers came back to return to more normal levels seen throughout previous weeks. For example, USDT on BSC fell from $1.4m to $569k (-58.1%), while USDC on ARB plummeted from $1m to finish with just $136k this week (-86.5%). Overall, the combined inflow and outflow decreased in an almost identical manner, with very minor change of only $752 from last week. Total stablecoin outflow once again exceeded inflow, with respective sums of $1.6m vs. $1.2m, indicating a lingering bearish attitude from users.
Affiliate News
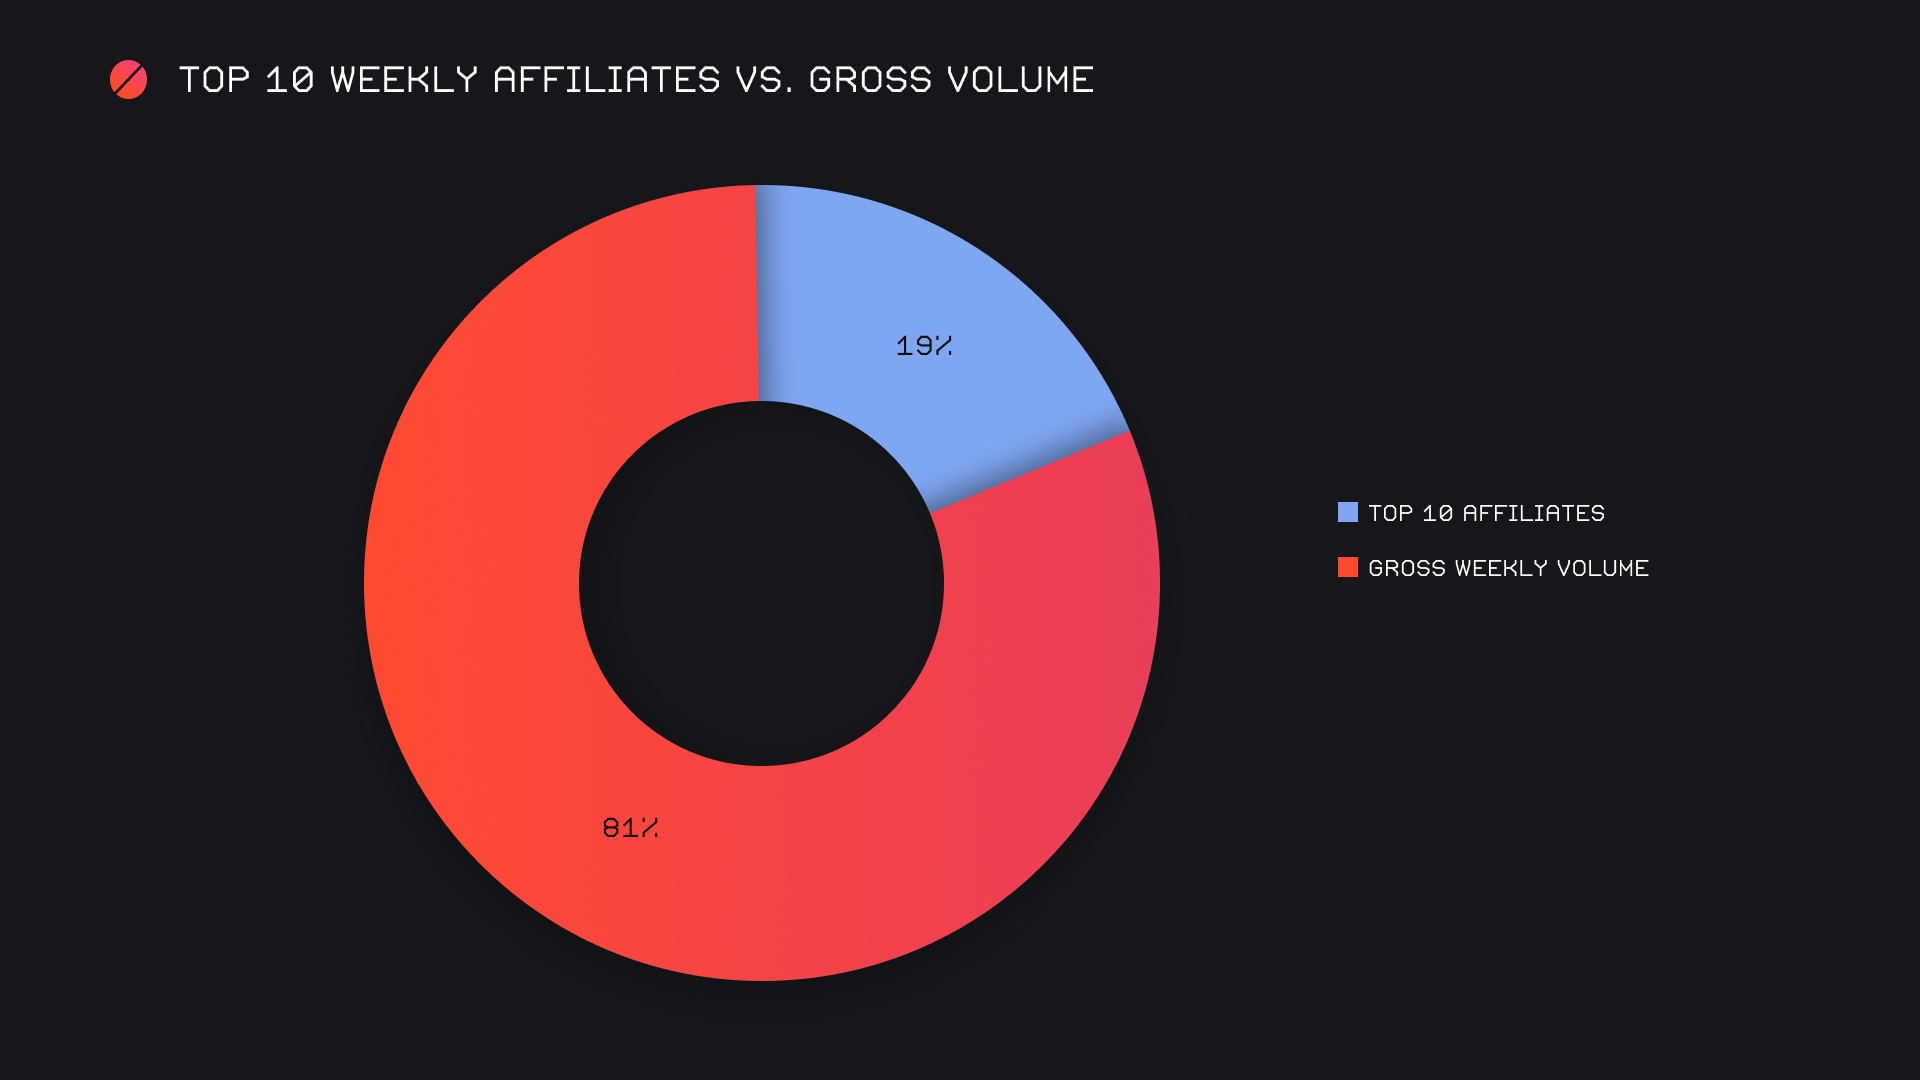
Our top 10 affiliates remained steady despite the drop in overall volume, and actually incurred a minor 2.9% increase for a net $1.8m. This was contradictory to the behavior of shift count which summed to 1,763 and was 10.9% lower than last week’s total. Our top affiliate had a slightly stronger performance than last week, representing 7.4% of the week’s total volume and 10.4% of the total shift count.
Overall our top 10 accounted for 19% of our weekly volume, 3.6% higher than noted in the previous report.
That’s all for now. Thanks for reading, happy shifting and we’ll see you next time.

