SideShift.ai Weekly Report | 9th - 15th December 2025
SideShift Weekly Report: Most popular coins, XAI staking performance, and other interesting insights about SideShift.ai and the cryptocurrency space. Welcome to the one hundred and eighty-fourth edition of the weekly stats report - your one-stop shop for all things SideShift.ai.

Welcome to the one hundred and eighty-fourth edition of the weekly stats report - your one-stop shop for all things SideShift.ai.
Highlights
- SideShift processed $5.79m in volume (−9.0%) and 6,766 shifts (−3.5%), as users traded more cautiously while prices moved lower.
- Stakers earned 120,759 XAI ($14.6k) at a 4.62% average APY, while XAI held steady near $0.12
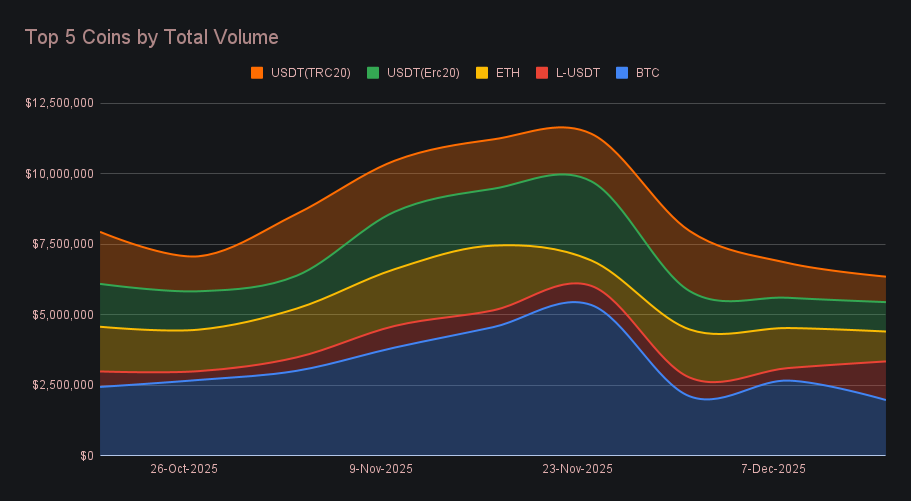
- BTC remained the top asset at $1.98m (−25.8%), though settlements fell sharply, narrowing its lead over stablecoins.
- L-USDT climbed to $1.37m (+210.0%), overtaking other USDT variants to rank second by total volume.
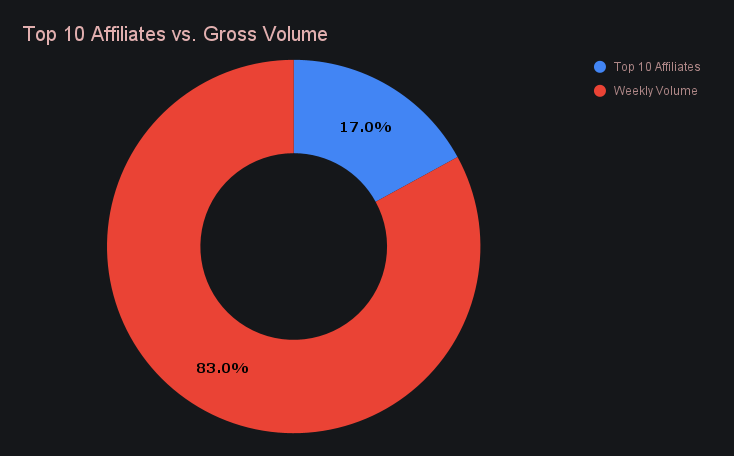
- Affiliate volume totaled $987k (−16.5%), with affiliates accounting for 17% of total weekly volume.
XAI Weekly Performance & Staking
XAI spent the week inching higher within a narrow corridor, holding above the $0.12 level and gradually working its way to $0.1215 by the close. The 7-day chart shows that slow climb clearly, with higher lows forming as the week progressed, while the 30-day view flattens that movement into a largely sideways stretch. Together, the two frames point to a market that is stable first and directional second, with short-term progress occurring against an otherwise steady backdrop. XAI’s market cap rose to $18.58m, marking a +0.54% increase from last week and extending a run of marginal but consistent gains.
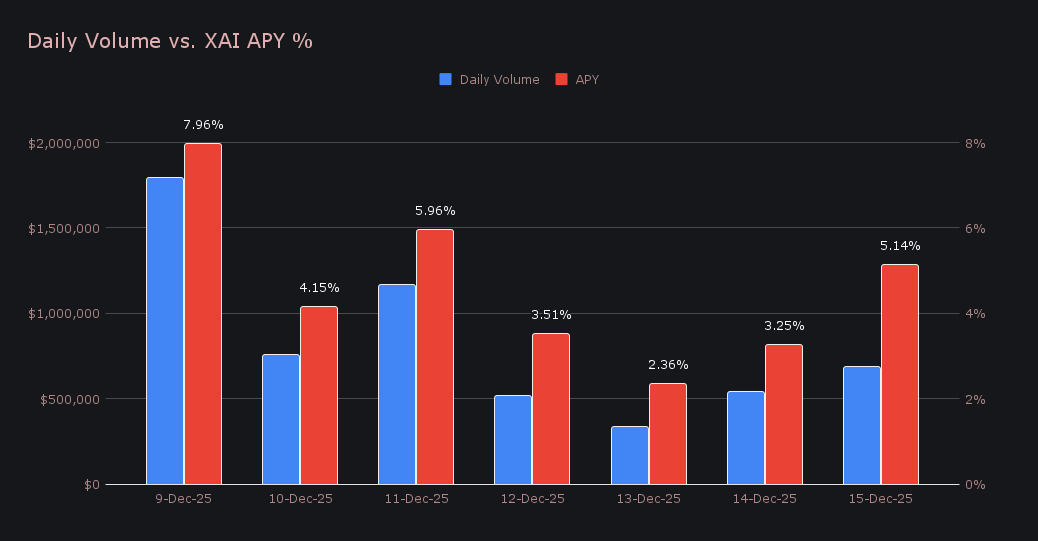
Staking activity was quieter and less uniform. A total of 120,759.31 XAI ($14,604.40) was distributed to stakers, with the average APY easing to 4.62%. Daily rewards varied noticeably alongside uneven shifting volume, producing a choppier pattern than last week’s payouts. December 9th stood out as the clearest peak, when 29,362.57 XAI was distributed at a 7.96% APY, supported by $1.79m in daily SideShift volume. Compared to the prior week, both total rewards and yields trended lower, aligning with the broader slowdown in activity rather than signaling any structural change.
Additional XAI updates:
Total Value Staked: 140,038,160 XAI (+0.1%)
Total Value Locked: $17,055,723 (+1.4%)
General Business News
Crypto markets skewed negative this week, with BTC’s price slipping toward $85k after a swift pullback that saw it break below near-term support levels. The descent in BTC dragged broader risk assets lower, with ETH falling back under $3k and most major altcoins following suit as selling pressure persisted across the market. One notable outlier was PIPPIN, an AI-themed memecoin birthed on Pump.fun earlier this year. Its market cap has now spiked from roughly $25m to over $450m this month, sparking debate and drawing controversy for its sharply concentrated holder base and outsized daily volumes despite the broader downturn.
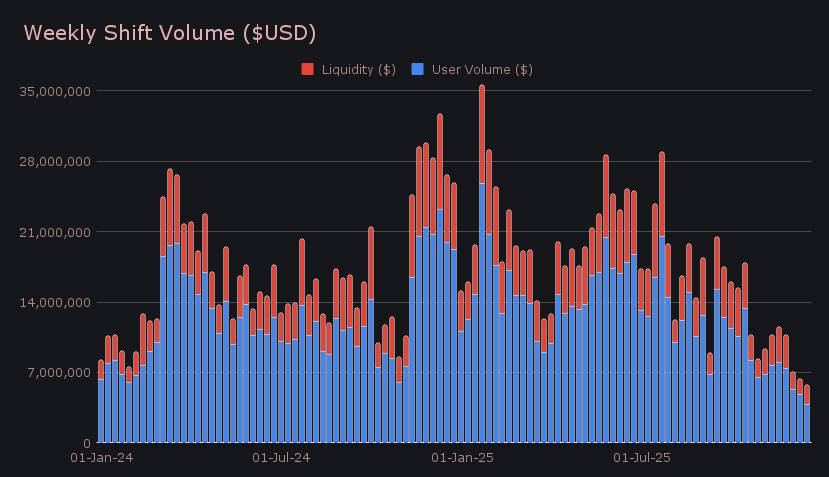
SideShift recorded $5.79m in gross weekly volume, a −9.0% decline from the prior week, as falling prices kept users largely on the sidelines. User shifting volume slid to $3.90m (−19.8%), reflecting a clear pullback in discretionary trading as BTC and ETH continued to trend lower. Liquidity shifting moved the other way, rising to $1.89m (+26.3%), interestingly being driven by increased activity on the Liquid network, where shifts were predominantly one-directional and skewed toward higher inflows. The most active pairs reflected this predominately defensive posture, led by BTC/USDC (ERC-20) at $296k, followed by ETH/TRX ($202k) and BTC/USDT (TRC-20) ($162k).
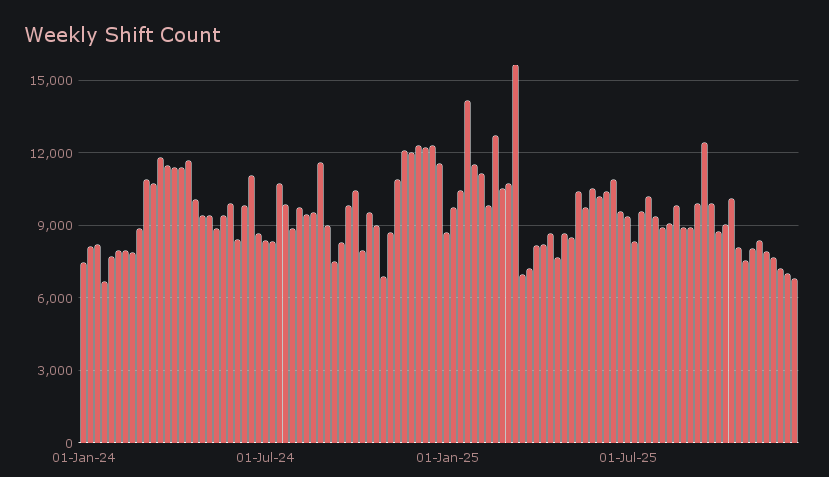
Shift count declined more modestly, finishing the week at 6,766 (−3.5%), reinforcing the widening gap between participation and dollar volume. While fewer large trades occurred, baseline engagement remained relatively intact, albeit at a lower gear. Viewed against the longer-term backdrop, weekly shift count is now drifting back toward the lower end of the range seen over the past two years, approaching levels last touched during prior market slowdowns. The combination of falling volume and a slower grind lower in count points to the same behavior seen across recent weeks: users are still present, but operating cautiously, with smaller, routine shifts replacing the heavier shifts that tend to surface when markets regain momentum. Daily averages reflected that tone, with 967 shifts per day alongside $827k in daily volume.
BTC remained the single largest contributor by total volume, but its lead narrowed meaningfully as activity cooled. Weekly volume fell to $1.98m (−25.8%), with declines on both sides of the shift underscoring how quickly engagement faded as price momentum turned lower. User deposits slipped to $975k (−26.9%), while settlements saw an unusually sharp contraction to $354k (−50.8%), leaving BTC still at the top of the leaderboard but visibly lagging the stablecoin complex beneath it. In the top-five chart, that relative slippage is clear - BTC’s share of total volume compressed notably week-over-week as shift activity tilted toward stablecoins.
Stablecoins occupied much of the space beneath BTC this week, though the composition of that activity shifted meaningfully. L-USDT surged to $1.37m (+210.0%), rising into second place by total volume, but the increase was driven less by user demand and more by liquidity shifting tied to uneven flows on the Liquid network. User activity was present, but not overly dominant, reinforcing that the jump reflected internal rebalancing rather than a drastic wave of new stablecoin positioning. By contrast, the two more established USDT variants moved lower. USDT (ERC-20) finished at $1.04m (−2.9%), with activity skewed toward user settlements, which totaled $461k (+9.7%), while USDT (TRC-20) declined more sharply to $903k (−26.8%) as participation cooled on both sides. Taken together, stablecoin volumes were shaped more by redistribution within the top ranks than by a broad expansion in stablecoin-led trading.
ETH closed the week with $1.06m (−25.4%) in total volume, remaining inside the top five despite a clear drop in activity. User deposits dipped to $523k (−7.5%), while settlements pulled back more sharply to $437k (−31.0%), moving ETH back toward a more even split after last week’s settlement-favored mix. Just below it, TRX and SOL both posted gains but fell short of breaking into the top group. TRX ranked sixth with $853k (+643.9%), a steep jump dictated by user settlements ($241k, +291.6%) even as deposits contracted, pointing to concentrated, one-sided usage rather than sustained engagement. SOL followed in seventh at $780k (+4.3%) and saw incremental increases across both deposits and settlements, though the move lacked the scale needed to challenge ETH’s position on the leaderboard.
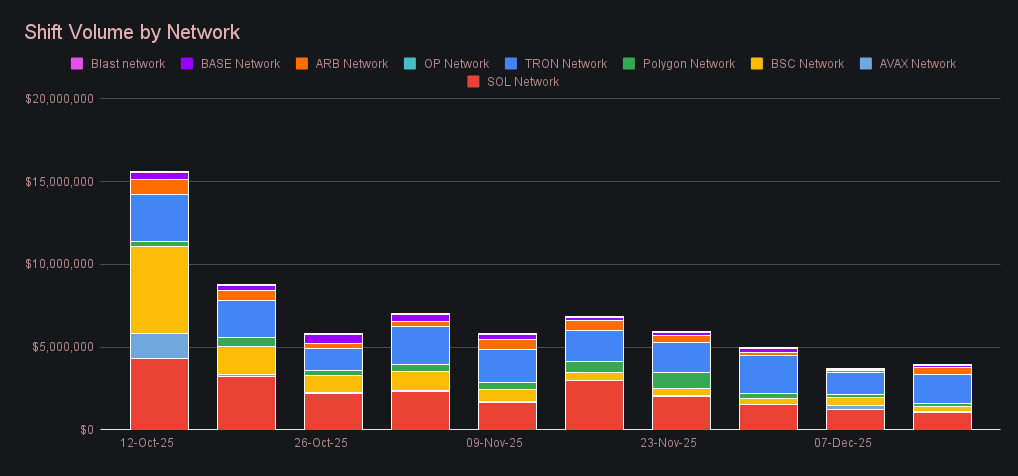
Alternate networks collectively inched higher to $3.89m (+6.0%), a modest rebound that contrasted with Ethereum’s −20.5% decline but did little to alter the broader picture. Activity across non-ETH chains remains thin, with brief surges across individual networks failing to translate into sustained momentum, ultimately leaving the group trending lower overall. The Tron network led at $1.76m (+30.2%), continuing to show greater consistency than its peers and reinforcing its position at the top of the group. The Solana network followed at $1.09m (−10.5%), extending its fifth consecutive weekly decline after often sharing the leadership role alongside Tron in prior periods. Arbitrum posted the sharpest move, climbing to $391k (+282.1%) off a low base, as BSC fell to $311k (−31.6%). Further down, Polygon reached $209k (+11.6%) and Base rose to $117k (+46.4%), though neither showed enough scale to challenge the leaders.
Affiliate News
Affiliate volume totaled $987k (−16.5%), reflecting continued pressure on integrations as overall activity remained weak across the platform. First place finished at $367k (+61.6%), taking the lead after consistently holding up over recent months while other integrations steadily declined, rather than due to a single volume spike. Second place fell to $180.5k (−63.9%), and third place declined to $62.7k (−52.7%), leaving our affiliate volume more concentrated at the top during the week.
Together, the top affiliates accounted for 17% of total weekly volume, down from 18.6% last week, representing a lower share within an already slow period of activity.
That’s all for now. This marks our final report of 2025 — thanks for following along. We’ll be back in the New Year; until then, enjoy the holidays and see you on the other side.
